As an observability tool, Grafana has a lot to offer. Not only can users utilize their opensource solution for decently comprehensive and scalable metrics, but they can take advantage of their cloud-based metrics and log analysis tool, too.
That said, Grafana isn’t always puppy dogs and rainbows. In fact, like many other tools out there, it comes with a fair share of complaints. Users complain about the dashboards being difficult to use and set up, the constant need for upkeep with multiple configurations, and even a lack of functionality when it comes to log analysis.
For this reason, many have set out in search of Grafana alternatives. Since you’ve landed yourself here, I’m guessing that you’re one of those people. Fear not! We’ve put together a comprehensive list of the 10 best Grafana alternatives out there today.
Grafana Features
Whether you choose open-source, DIY Grafana or Grafana Cloud, the solutions and features are pretty much the same. In all cases, you get:
- Metrics
- Logs
- Traces
- Profiling
- Visualization dashboards
- Alerting
Grafana Pricing
Grafana’s open-source solution is free to use. But keep in mind, that doesn’t mean that it’s completely free. Sure, you’ll save a buck or two with a subscription but never underestimate the TCO – Total Cost of Ownership when it comes to open source software.
With Grafana Cloud, you can negate the cost of ownership, and opt for a subscription-based plan. Those plans are as follows:
Cloud Free is, you guessed it, free, but limited. It comes with a monthly limit of 50GB logs, 50GB traces, 50GB profiles, and 10k metrics. All of this can be utilized by 3 users.
Cloud Pro gives you 50MB for logs, traces, and profiles, 10K metrics, but then it includes an additional usage-based cost of $0.50 per GB ingested, 30 days retention, as well as $20 per user, and metrics are $8 per 1K dataseries, plus you pay for visualizations, plus you pay for “virtual user hours”. Yes, very complicated. The usage part is most likely where customers end up getting surprised.
Cloud Advanced starts at $299 per month and has higher numbers for everything. Instead, it grants the user access to all of Grafana’s enterprise plugins.
Now, let’s look at some of the top Grafana competitors.
10 Best Grafana Alternatives
1. Sematext
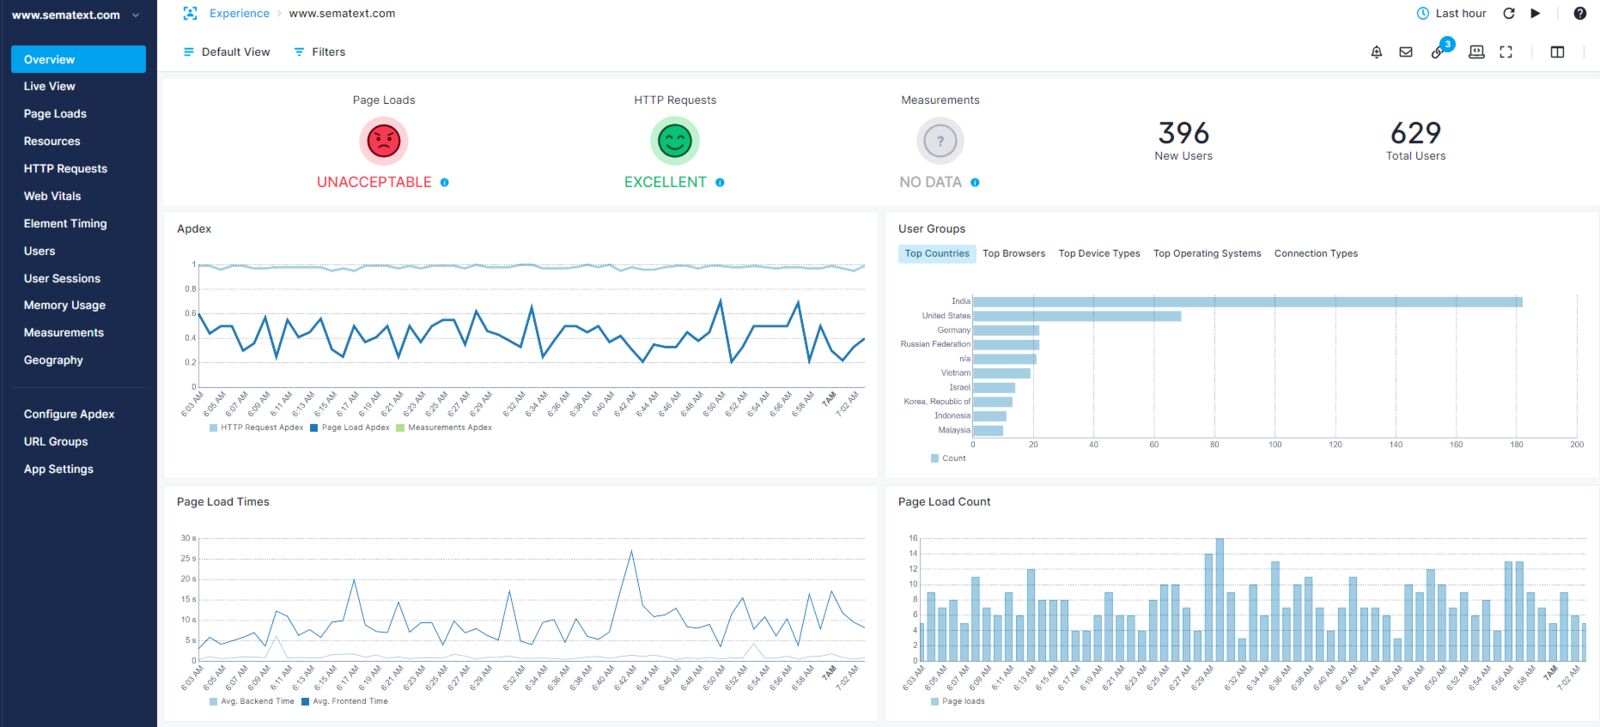
Sematext is a full-stack observability solution. You get exactly what you need to optimize the performance of your website and apps, and troubleshoot when they’re running slow.
Sematext offers Log Monitoring, Synthetic Monitoring, Real User Monitoring, and Infrastructure Monitoring. So there is overlap with Grafana, but it’s not 1-to-1.
Sematext Logs is a centralized hub for all your logs, no matter where they come from in your whole infrastructure and applications. You can troubleshoot problems as they come across your infrastructure, all from this centralized environment.
Even better, Logs Pipelines allow you to adjust or eliminate log events that you don’t want at all. As a result, this helps you control your costs, allowing you to save your data usage for only the log events that are important to you. You can even trim unwanted fields, enhance your logs, or transform them as needed.
With Synthetic Monitoring, you can passively test the performance and availability of all your websites and APIs. Synthetics simulates user interactions to run tests from multiple global locations and private locations, for when you want to monitor services behind your firewall.
Sematext Experience, also known as Real User Monitoring (RUM), uses real user data to give you insight into tracking metrics like UI interactions and page load times. Data is collected in a comprehensive overview with User Satisfaction metrics that use Apdex Scores.
Infrastructure Monitoring gives you additional insights into the usage of your servers, cloud instances, containers, Kubernetes, and more. Keep tabs on search engines, databases, queues, and more when they’re operating within your infrastructure.
With Sematext, there are even tailor-made integrations for specific services for both Monitoring and Logs. You can start without having to configure these integrations yourself, as they come with out-of-the-box dashboards and alert rules.
Features
- Log Monitoring
- Full stack observability
- Infrastructure Monitoring
- Real User Monitoring
- Synthetic Monitoring
- SSL Certificate Monitoring
- Status Pages
- Alerting with anomaly detection
- Correlation
- 100+ integrations
Pros
- Flexible payment options, plans, and per-App pricing
- Logs Pipelines for granular cost control
- Seamless setup process with accommodating support staff according to a number of reviews on G2
- Internal and external monitoring capabilities
- Customizable alert triggers
- Smooth incorporation with Incident Management Systems
Cons
- Fewer integrations than some larger competitors
- No support for transaction tracing
Pricing
Sematext’s pricing options are easy to scale, depending on what you need, and come with zero obligations. You can cancel, upgrade, or downgrade at any time. Also, the pricing is much simpler to understand than pricing for the Grafana Cloud, plus you can use the cost calculator to see how much you might pay for Sematext.
Log Monitoring has a free plan and the paid options start at just $50 per month. This $50 plan comes with 1GB of ingested data per day and 7 days of retention, but you can scale this up to meet your needs.
Synthetic Monitoring has two pricing options. First, you have the pay-as-you-go plan. This plan offers single HTTP Monitors for $2 each and $7 per Browser Monitor.
The other pricing option is for monitor bundles. These start at just $29 per month but offer you more options. With the $29 plan, you can get up to 40 HTTP Monitors, 5 Browser Monitors, and 30 days of retention.
Infrastructure Monitoring also has a free plan, but the paid plans start at $3.60 per host per month. The $3.6 price tag comes with a standard 7 days of retention already, but you can customize this to meet your needs.
Finally, Real User Monitoring starts at just $9 per month. This comes with a 25,000-page view allowance per month and gives you 7 days of retention. Just like all of the other options, though, this can be scaled up to meet your exact needs.
2. Datadog
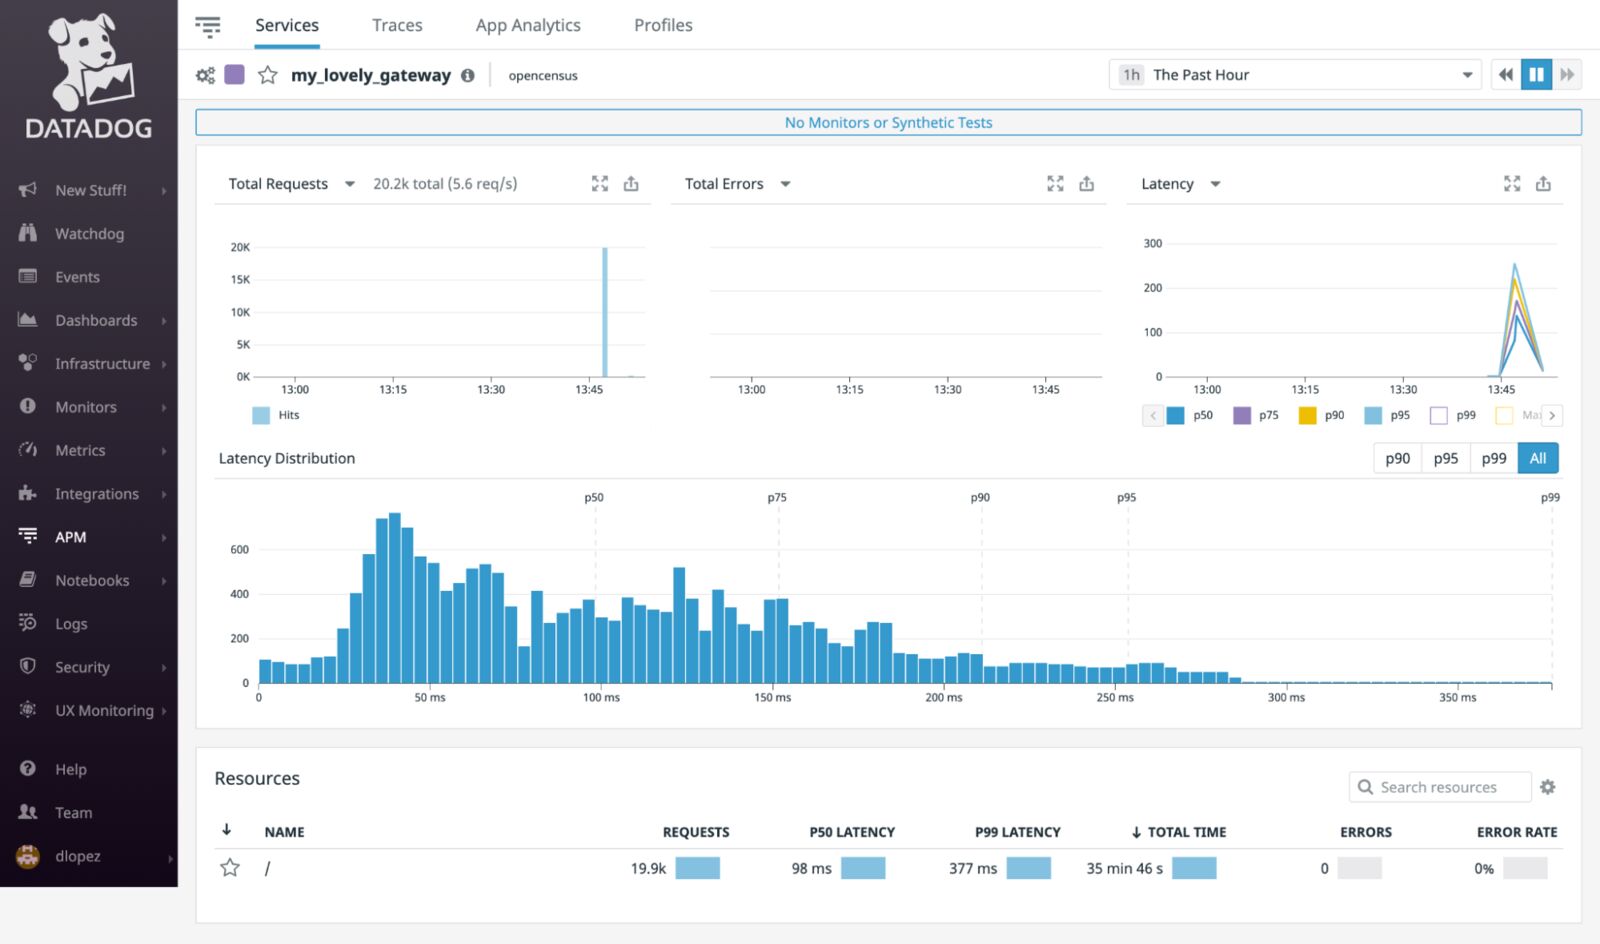
Datadog is a massive tool that offers a lot of features and solutions, including log management. But before we dive too deep, please note that Datadog is expensive. It absolutely is not for anyone other than large-budgeted corporations. Just take a look at what people are saying on X.
Datadog is considered to be a full-stack monitoring solution, but its log management is quite comprehensive. You can easily ingest, process, live tail, and archive all your logs.
Datadog is a good Grafana alternative, but really only if you’re looking to massively scale up your observability arsenal. That said, it can be an overwhelming jump. They offer 20+ individual solutions, each with its own price and feature set.
Features
- Log Management and Monitoring
- Synthetic Monitoring
- Serverless Monitoring
- Infrastructure Monitoring
- Browser Monitoring
Pros
- Comprehensive monitoring features
- Extensive range of integrations
- Intuitive data visualization
- Customizable graph widget
Cons
- Very expensive – Only for very large budgets
- Overwhelming with 20+ individually priced solutions
- Users report poor customer service
- Users report a steep learning curve
Pricing
Datadog has 20+ individually priced solutions, so we won’t get into all of them. But, there are some solutions that we’ll mention.
- Log management starts at $0.10 per ingested GB and $1.70 per million log events
- Synthetic Monitoring is $7.20 per 10,000 API tests and $18 per 1,000 browser tests.
- Infrastructure monitoring starts at $18 per month per host
- Real User Monitoring starts at $2.20 per 1,000 sessions per month
Even just a quick glance can probably tell that your expenses can stack up quickly with Datadog.
If you really want to see how expensive Datadog is, then check out our page on Sematext vs Datadog. We broke down their pricing and compared it to Sematext so that you can get a clear visual of how much you could be saving.
3. New Relic
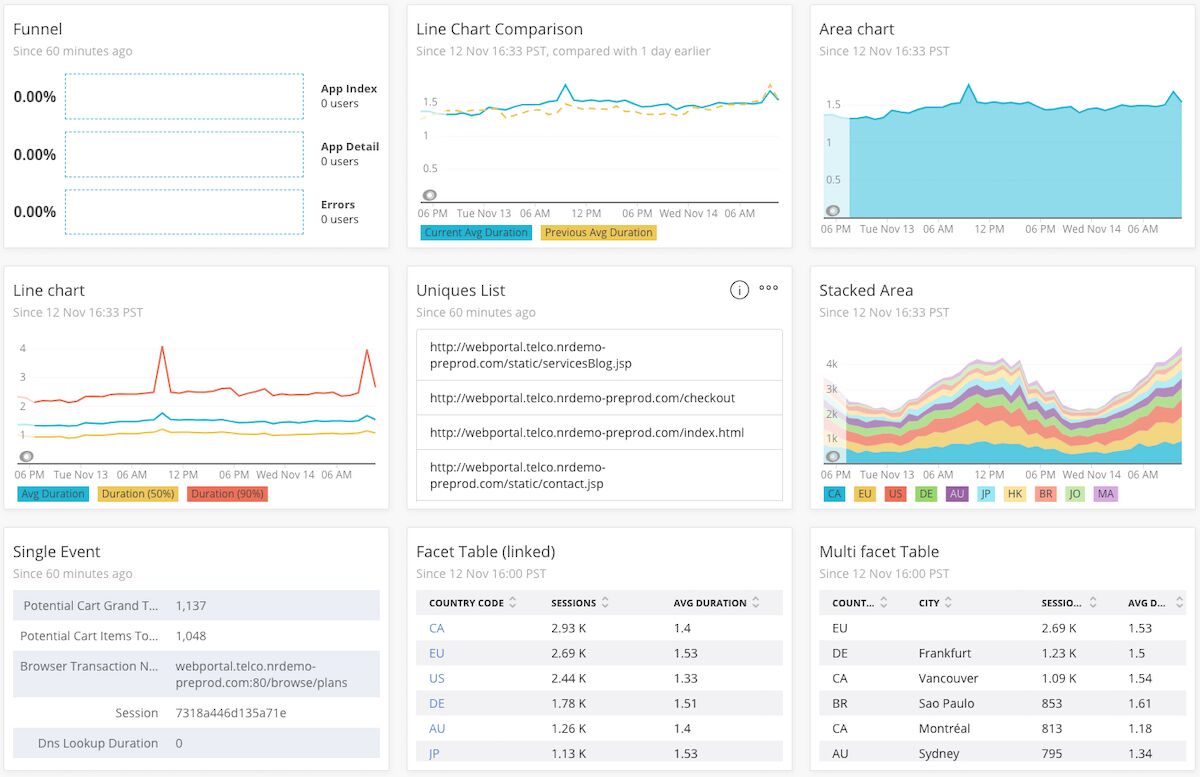
New Relic has been around since 2008, making it one of the oldest and most established Grafana alternatives on this list. It is a powerful observability tool that features advanced logging and monitoring capabilities.
Like many Grafana competitors, New Relic offers users preconfigured dashboards that help users streamline their processes for setting up and analyzing data. In addition, New Relic can fairly seamlessly integrate with a number of platforms that help you correlate data across your stack, expediting your troubleshooting process.
Features
- Browser monitoring
- Synthetic Monitoring
- Log management and monitoring
- Serverless monitoring
- Infrastructure Monitoring
Pros
- Offers a large number of integrations
- Customizable dashboards
- Agents that are easy to deploy
Cons
- Confusing pricing model that includes per-seat pricing
- Very expensive at scale
- Dependency on agent installation on various devices
- User interface feels outdated and clunky
Pricing
New Relic’s pricing model can be somewhat intricate to decipher, as it involves additional costs for various features. Across all plans, a $49 charge is applicable for what they term “core” users. To grant users full platform access, expenses rise to $99 for the standard plan, $349 for the pro plan, and $549 for the enterprise plan, per user. This per-user pricing can make New Relic rather expensive.
In addition to the base charges, New Relic provides users with a complimentary 100GB of ingested data for all plans. However, exceeding this limit incurs additional charges – $0.30 for “Original” data ingestion and $0.50 for “Plus” data ingestion, per GB. It’s essential to be mindful of these data overage costs when considering New Relic’s pricing structure.
Want to see how Sematext stacks up? Check out the Sematext vs New Relic comparison.
4. Splunk
Splunk is a well-known log management solution that’s been around forever. It offers a variety of observability solutions, making it an ideal Grafana alternative in terms of functionality. Splunk offers users Log Management, Synthetic monitoring, Infrastructure Monitoring, APM, Security Monitoring, and more.
Splunk’s Application Performance Monitoring (APM) is a solution for cloud-native, microservice-based applications. It also offers auto-instrumentation for popular stacks like Java, Kotlin, Python, Ruby, and more. Users also have the ability to create their own instrumentation using open APIs.
Splunk is one of the founding members and active contributors to OpenTelemetry, which means that Splunk APM supports open, neutral instrumentation.
Sadly, Splunk is another uber-pricey solution whose sales folks are targeting large enterprises with deep pockets ready to sign big contracts. See below for details.
Features
- Log aggregation and monitoring tool
- Application monitoring
- Infrastructure Monitoring
- Real User Monitoring
- Automated anomaly detection
- Synthetic Monitoring
Pros
- Ability to install add-ons
- On-premise or cloud-based
- Supports multiple formats
- Works well with unstructured data from various sources
Cons
- Pricey!
- Requires user to continuously stay updated with SPL (Splunk Processing Language)
- Outdated user interface design
- Limited data modeling and machine learning capabilities
Pricing
Splunk offers a decent number of monitoring, security, and detection tools. Unfortunately, they only offer prices for some of their observability tools, and even those prices are kind of buried in the website.
Synthetic Monitoring starts at just $1, but with that, you only get 10,000 Uptime requests. Incident Response starts at $5 per user per month. Real User Monitoring (RUM) starts at $14, but it only covers 10,000 sessions. Infrastructure Cloud Monitoring starts at $15 per month per host. Finally, APM starts at $55 per month per host.
Keep in mind that these prices are only available if you opt for annual billing, meaning you have to commit to Splunk for an entire year.
Want to see how Sematext stacks up to Splunk? Check out our page on Sematext vs Splunk.
5. AppDynamics
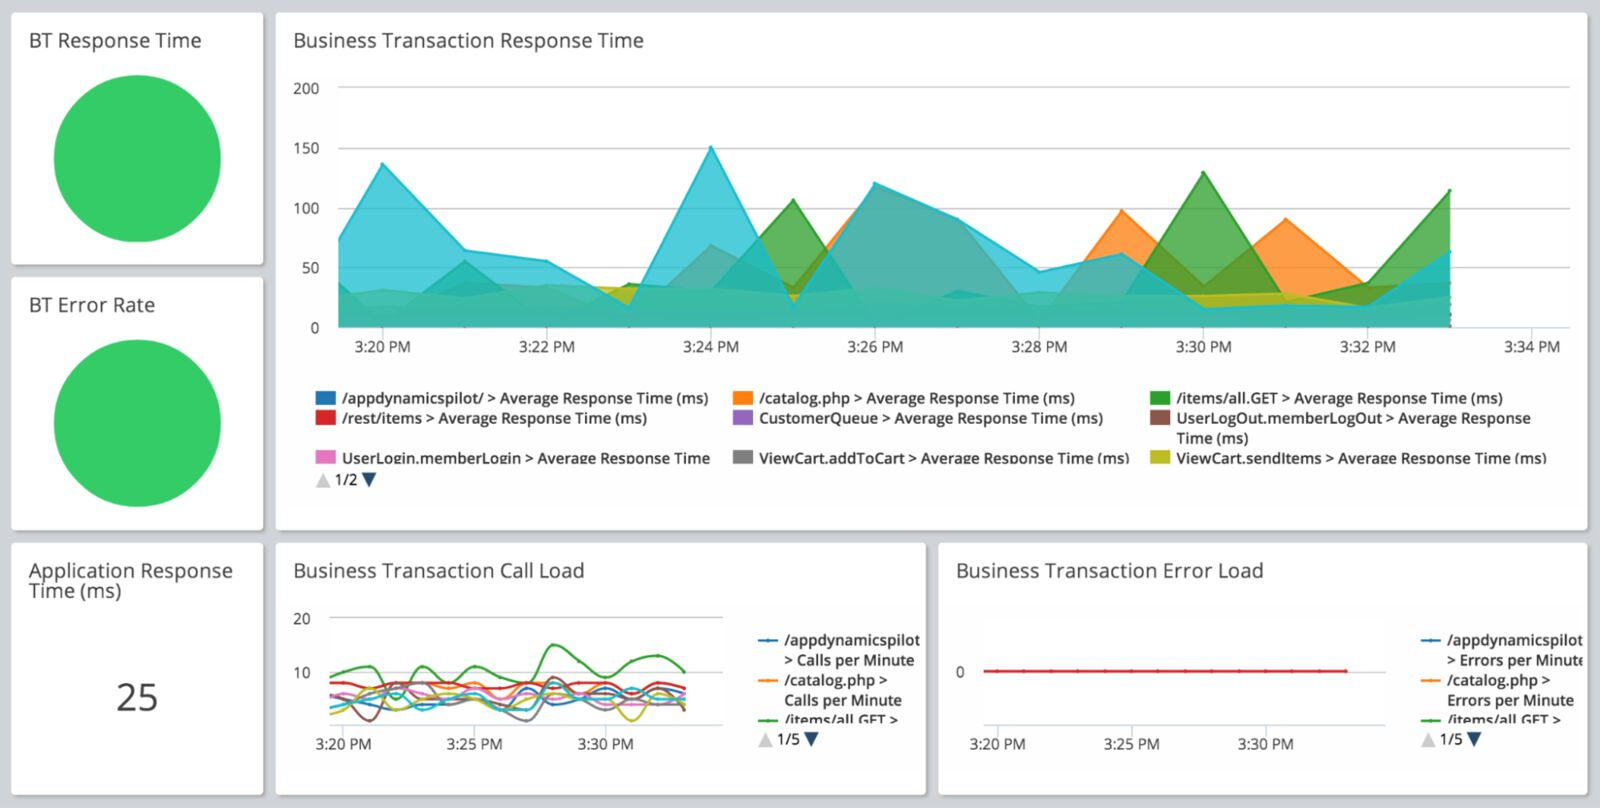
AppDynamics presents a cloud-based performance management tool, granting users real-time
visibility into the health and performance of their applications. As an excellent alternative to Grafana, AppDynamics is particularly renowned for its end-user monitoring (EUM) capabilities, ensuring users are well-informed about end-user errors, issues, crashes, and page-loading details. This enables businesses to tap into valuable insights, swiftly and effortlessly resolving customer issues.
Features
- Synthetic Monitoring
- Infrastructure Monitoring
- Application performance management
- Real User Monitoring
- Business performance monitoring
- Log Analytics
Pros
- Streamlined new application deployment process
- Option for code-level visibility, enabling in-depth performance analysis
- Intuitive workflow monitoring integrated into application tracking
- Predictive intelligence offers valuable insights into tool usability
- Enhanced transaction visibility for comprehensive performance analysis
Cons
- Very expensive
- User reviews complain of various difficulties across the entire platform
- A steep learning curve, particularly for users new to application monitoring tools
- Challenges with integrating with different event sources
Pricing
AppDynamics provides users with a variety of pricing choices, commencing at $6 per month for fundamental Infrastructure Monitoring. However, to access Synthetic Monitoring, plans begin at $60 per month, with the Enterprise Edition requiring a cost of $90 per month per user.
Want to see how Sematext stacks up? Check out our page on Sematext vs AppDynamics.
6. Dynatrace
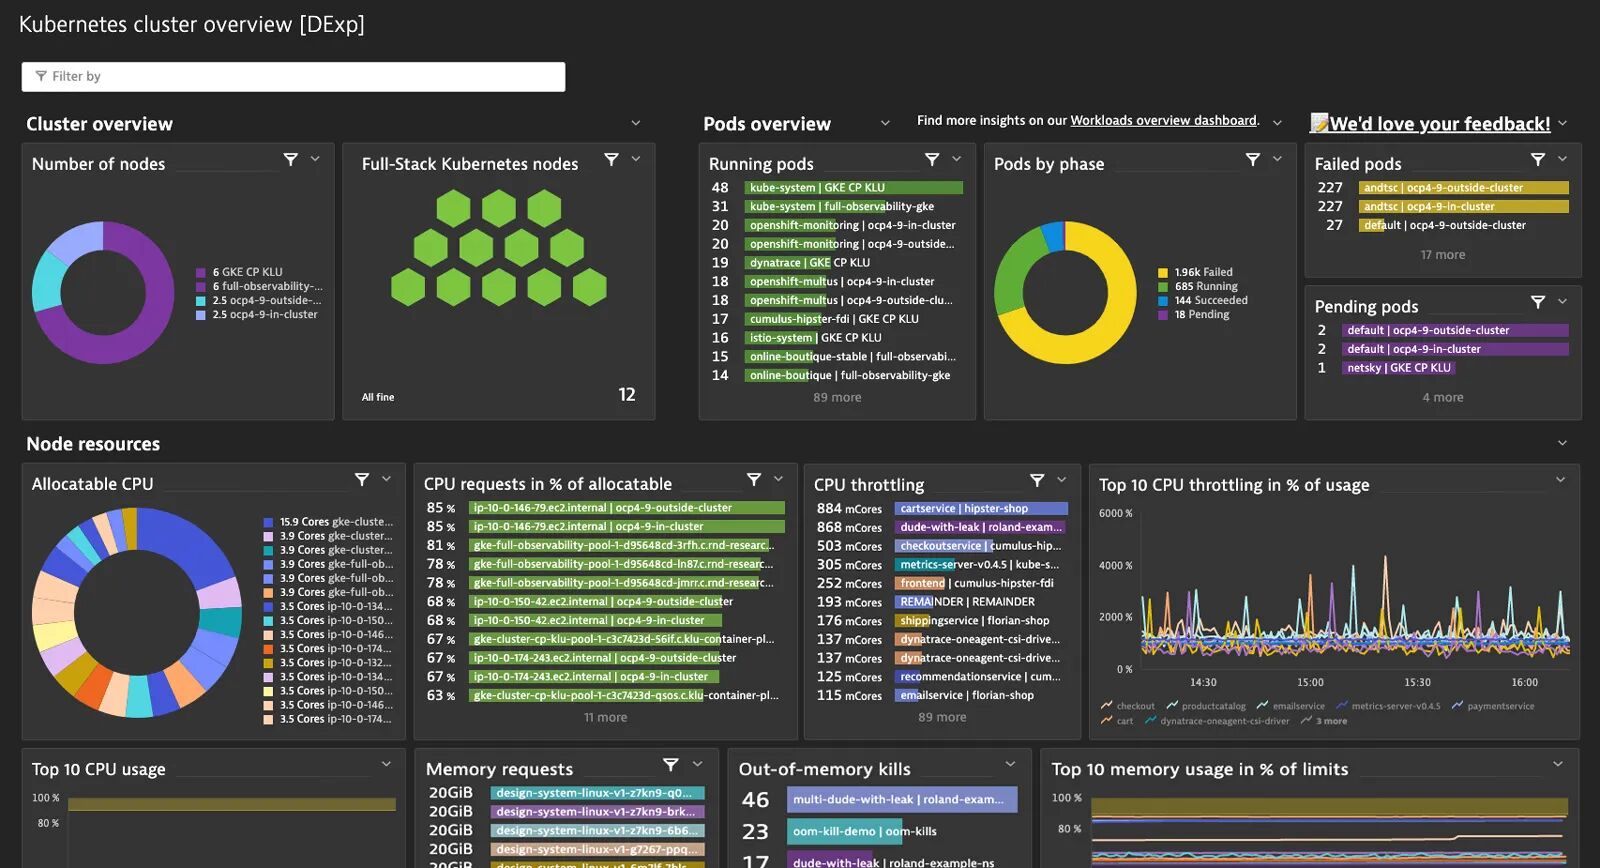
Continuing with the trend of all-in-one platforms, Dynatrace is a great alternative to Grafana. It has a big focus on Application Performance Monitoring (APM), but it offers just about everything Grafana does.
Dynatrace offers Security Analytics for what they call advanced threat protection. They also offer Security Protection, allowing users to discover, analyze, and protect themselves from unknown vulnerabilities.
Dynatrace is great for big businesses looking for enterprise-level monitoring. It’s great for providing essential business metrics across numerous digital platforms, and even implements casual AI to help automate complex workflows.
Features
- Full-stack Monitoring
- Infrastructure Monitoring
- Application Security
- Real User Monitoring
- Synthetic Monitoring
- Log management and Analytics
Pros
- Lots of observability options
- Priced based on data that you use
- Powerful alerting
- Powered by AI
Cons
- Pricey!
- User reviews report that the tool is complex to use
- User reviews report bad customer service and support
- User reviews report poor documentation
Pricing
Dynatrace has a unique pricing model. Instead of charging per GB, they charge per request or hour.
For instance, a synthetic request is $0.001. This might sound like a deal, but let’s put this into perspective. If you set up an HTTP monitor from a single location with 1-minute intervals, the monthly cost would add up quickly. That equation looks like this: 0.001 * 1440 * 30 = $43. 1440 represents the number of runs in a month and 30 is the count of days. This means that you’re paying $43 per month for a single HTTP monitor.
With Infrastructure Monitoring, you’ll be paying $0.04 per hour. With 24 hours in a day and the average month having 30 days, the monthly charge per host is 0.04 * 24 * 30, which totals $28.8 per host.
Real User Monitoring is charged per session, each one costing you $0.00225. Quick math shows us that 100,000 sessions would cost you $225 per month.
Want to see how Sematext stacks up? Check out our page on Sematext vs Dynatrace.
7. Sumo Logic
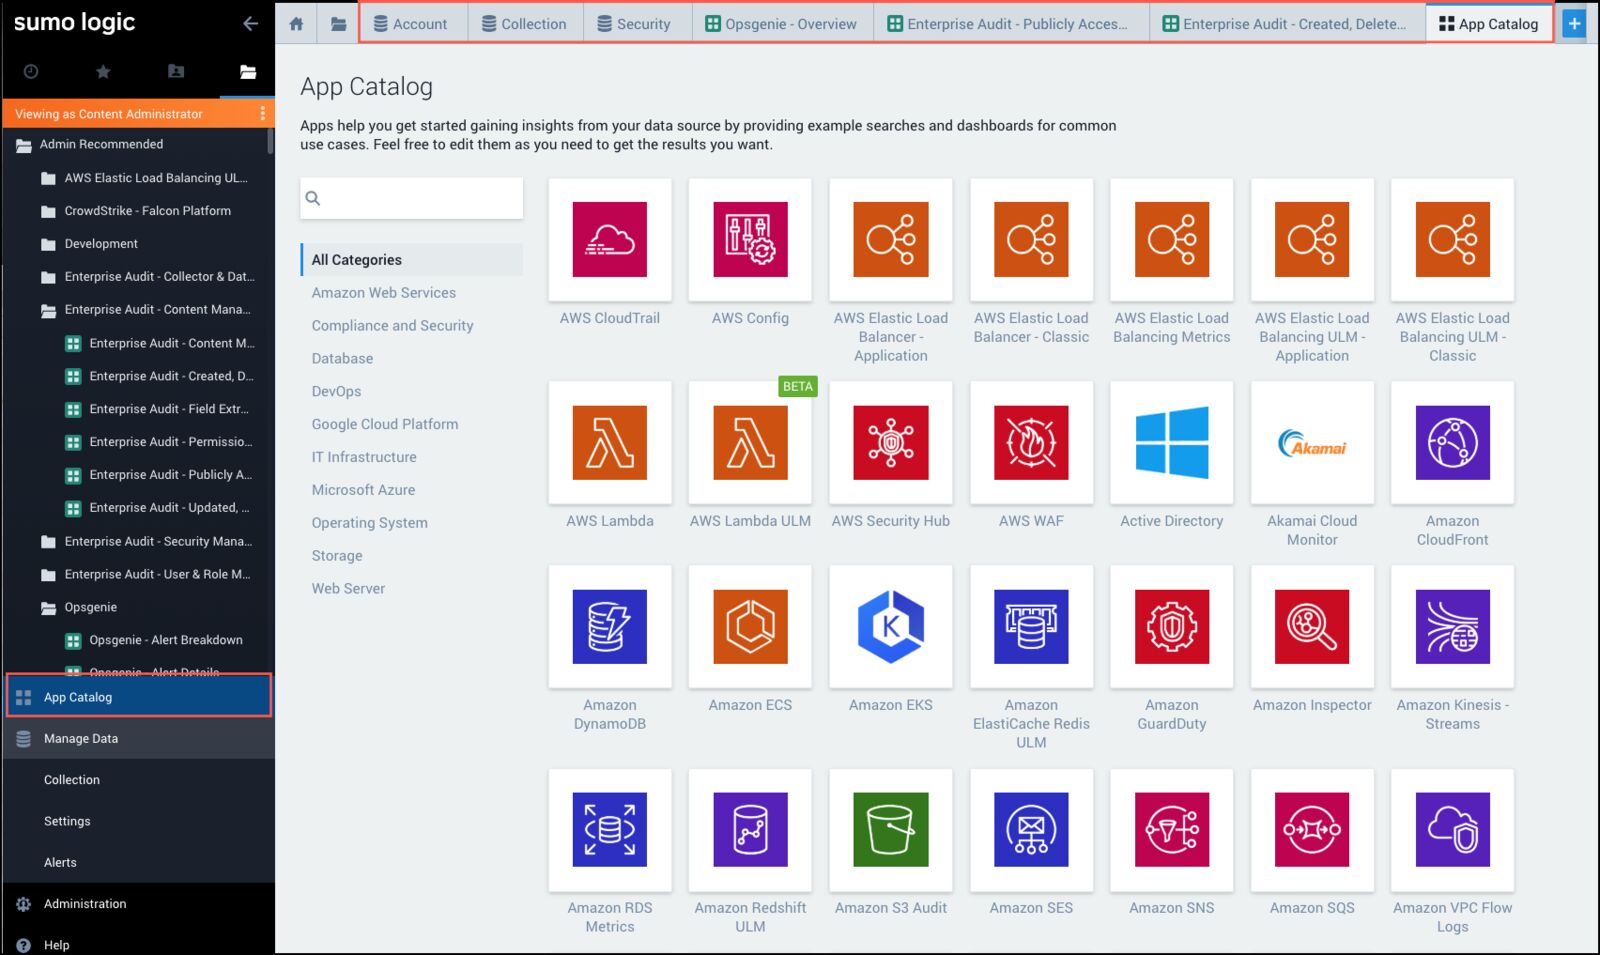
Sumo Logic is aimed at large corporations, but it also offers decent log management capabilities, making it a good choice of Grafana alternatives.
What makes it unique on this list is the cloud-based machine learning. This helps in processing big data, which makes it ideal for massive corporations.
If you’re looking for something more than basic log management, Sumo Logic is a decent option for end-to-end monitoring. It comes with root cause analysis, anomaly detection, and pre-set alerts.
Features
- Log Analytics
- Cloud SOAR
- Cloud SIEM
- Cloud Security Analytics
- Application Observability
- Infrastructure Monitoring
Pros
- Decent selection of observability and security tools
- Real-time insights
- Powered by AI
- Pre-set dashboards and alerts
Cons
- Expensive
- User reviews complain about the complexity of the tool
- User reviews complain about data collection lagging
- User reviews complain about slow searching for large data ranges
Pricing
Sumo Logic is able to process big data, which means that it is aimed at companies that have a lot of data. In other words, Sumo Logic is aimed at big corporations with big budgets.
If you’re looking for their 3 security solutions: Cloud SOAR, Cloud SIEM, and Cloud Security Analytics, you will have to contact their sales team for prices.
Application Observability starts at $2.31 per GB.
Infrastructure Monitoring starts at $0.50/1000 data points per minute (DPM) per day. DPM is the per-minute rate at which metric values are sent individually to Sumo Logic.
Not sure about how many DPMs your server, VM, Kubernetes pod, or container will send? How about a server with more CPU cores or more disk partitions? This makes it very difficult to predict costs.
Finally, Log Analytics is a staggering $3.30 per ingested GB. Quick math tells us that if you set yourself a 1GB per day limit, you’ll spend roughly $100 per month.
If you’re unfamiliar, 1GB logs/day is not very much for even very small applications. They offer a retention window of anywhere between 1 day and 5,000 days, but nowhere will you find any information on how it affects the cost.
8. Loggly
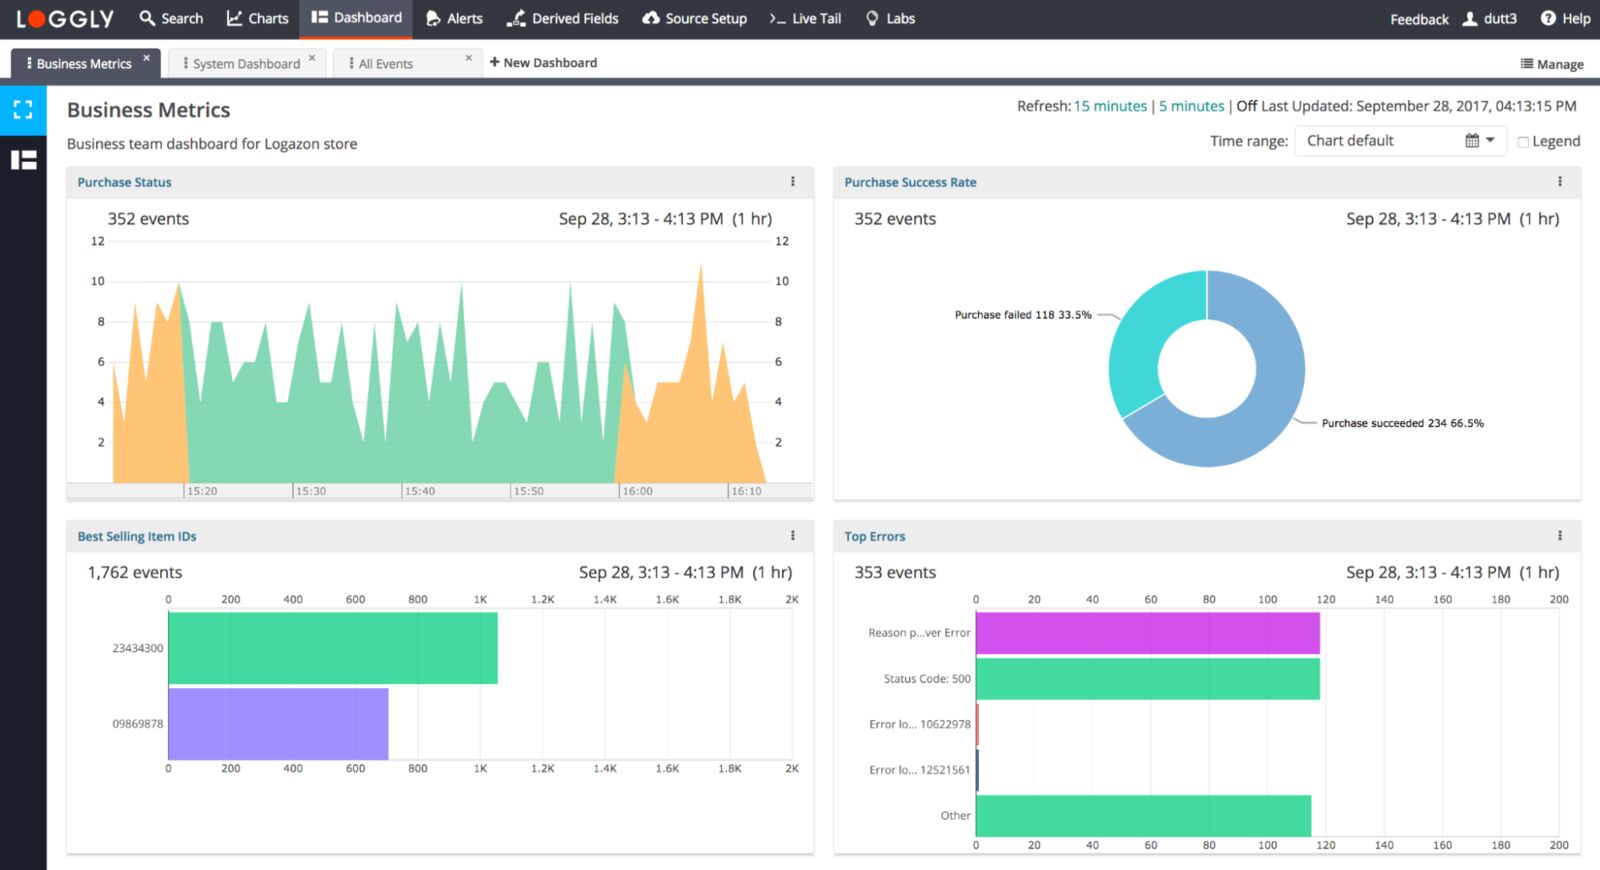 Another log management-focused Grafana alternative that we’re adding to this list is Loggly from SolarWinds. Loggly is a cloud-based service that allows users to transmit over HTTP/SYSLOg directly.
What makes Loggly a great alternative to Grafana in terms of log management is it offers automatic parsing for various formats and sources like Linux Logs, Windows, Docker, AWS, Heroku, and Syslog.
Perhaps its most well-known feature is the field explorer. This lets you search, filter, and even summarize logs from a single view. This allows you to easily view event frequency, select fields and values to filter, and apply your own custom parameters without having to type in a query.
Loggly is agentless, which means that all log-aggregating components in your infrastructure must be preconfigured to forward logs to its database.
Features
- Log management and analysis
Pros
- Unlimited users
- Built-in email alerting
- Comprehensive, graphical dashboards
Cons
- Expensive considering the limited functionality
- Anomaly detection only available with enterprise plan
- User reviews report slow data propagation
- Limited parsing rules
Pricing
Loggly offers 4 main pricing options. The first option is the free but highly limited version. From there, the prices start at $79 for the Standard plan, $159 for the Pro plan, and $279 for the Enterprise plan.
Each plan has increasing data allowances, users, sources, and more. However, please note that these are the starting prices. Although the enterprise plan starts at $279, they do not specify a monthly data volume allowance.
It is important to mention that these are the prices if you are billed annually. If you choose to go with Loggly, you will be committing to paying for and using them for an entire year.
Want to see how Sematext stacks up? Check out our page on Sematext vs Loggly.
9. Elastic Stack
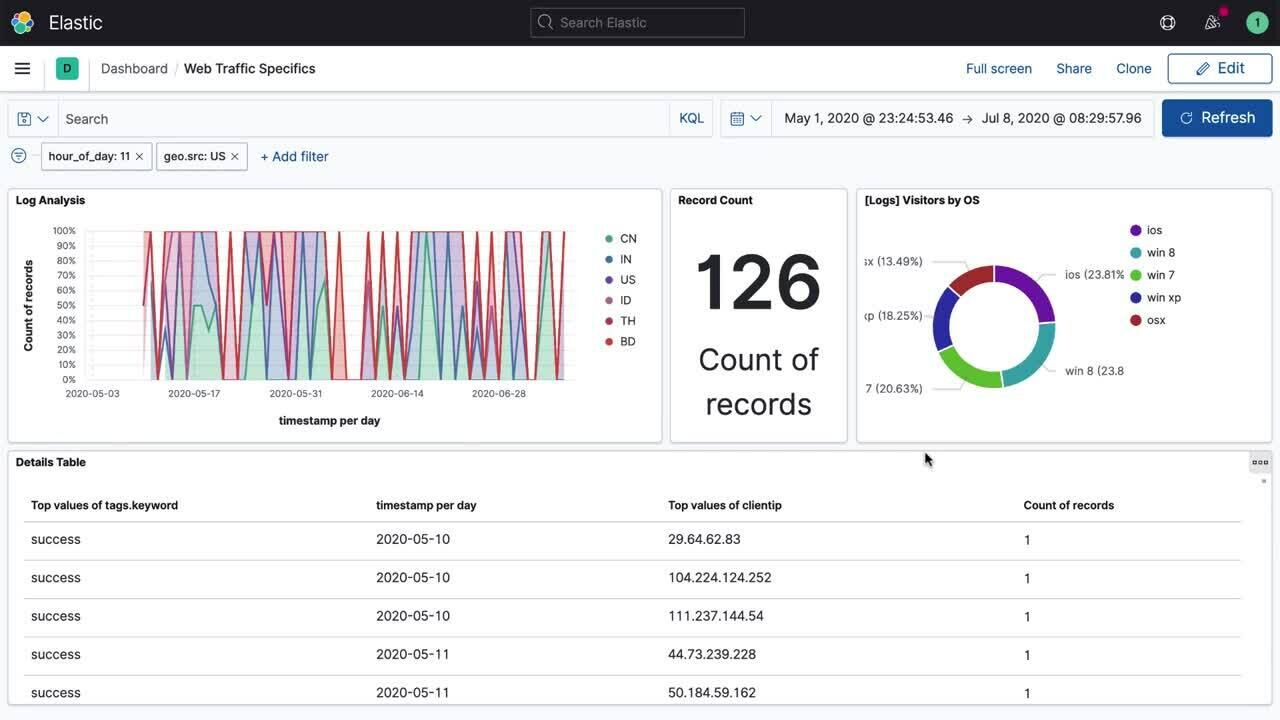
Formerly known as ELK, Elastic Stack is an open-source solution for log management. All-in-all, Elastic Stack is made up of 4 distinct tools:
- Elasticsearch – Distributed JSON-based search engine
- Logstash – Log ingestion and pipeline processor
- Kibana – Data visualization for Elasticsearch
- Beats – Single-purpose, lightweight data shippers
The appeal to Elastic Stack is that it doesn’t cost anything to download and use. Of course, like any open-source solution, there will be additional management costs. That being said, once it’s installed, you will gain instant access to all the tools listed above. Using these tools, you can ship data from multiple sources, process it, and then subsequently store it in a central location.
It even comes with a web-based interface that allows you to visualize and analyze data fairly easily.
Features
- Log management and analytics
Pros
- Open-source
- Library of free plugins
- Supportive and helpful community
Cons
- Complex management requirements
- The cost of ownership can be expensive
- Reliability and uptime issues
- Data useability challenges
- As a result of the cons above – scaling challenges
Pricing
As we said before, there’s no upfront cost of downloading and using Elastic Stack. But, the cost of ownership, managing, and maintaining this open-source tool is where the bills start to stack up.
Just as an example, a daily log data ingestion of 100GB/day on AWS with industry-standard best practices for Elastic stack configuration and data retention creates a hosting cost somewhere around $180,000 annually. (Source: ChaosSearch)
Want to see how Sematext stacks up? Check out our page on Sematext vs Elastic Stack.
10. ManageEngine Applications Manager
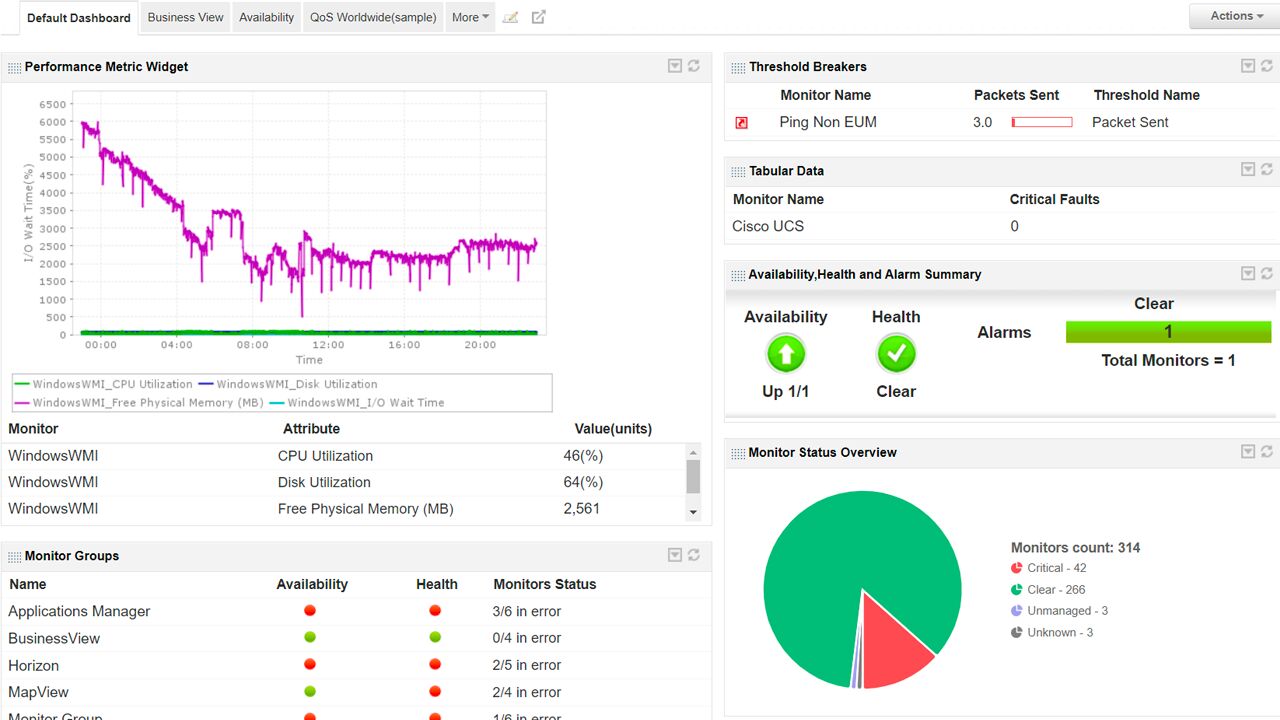
Applications Manager provides comprehensive Application Performance Monitoring (APM) that includes compatibility with Java, .Net Core, Node.js, PHP, and Ruby applications. The platform also offers synthetic transaction monitoring that employs Selenium-based scripting, authentic browser assessments from Chrome and Firefox, and several test locations.
Their Real User Monitoring (RUM) presents network awareness along with performance metrics rooted in site, browser, device, and ISP specifics. It further grants visibility into web transactions, user sessions, JavaScript errors, and a plethora of other metrics. ManageEngine additionally offers multi-cloud supervision, encompassing servers, databases, container monitoring, and more.
Features
- Application Performance Monitoring (APM)
- Infrastructure Monitoring
- Synthetic Monitoring
- Real User monitoring (RUM)
Pros
- Centralized and comprehensive view
- Real-time performance monitoring
- Multi-cloud visibility
Cons
- Limited customization options for alerts
- User reviews report that the tool is complex
- User reviews report that the endpoint data is not always accurate
- User reviews report scalability issues
Pricing
Unfortunately, ManageEngine does not offer any sort of price on their website. If you want to get any details on how much this tool will cost you, then you will have to contact them and request a quote.
Conclusion
If you’re in the market for a Grafana alternative, then feel free to reference this list of its competitors as often as you need. That being said, nothing can replace the information gained from doing your own research. Take your time, sign up for as many free trials as you need, and don’t rush! It’s essential to make the right decision, not a fast one.
And, if you want to see more of what Sematext has to offer, you have lots of options. Schedule a demo, sign up for a free trial, or check out our interactive demo today.