Troubleshoot Faster!
- Collect & correlate all Solr / SolrCloud metrics, logs, and events
- Collect JVM and infrastructure metrics
- Auto-detect Solr & auto-attach to JMX without Solr agent install
Monitor key Solr & SolrCloud metrics for Real-Time Visibility into Your Environment
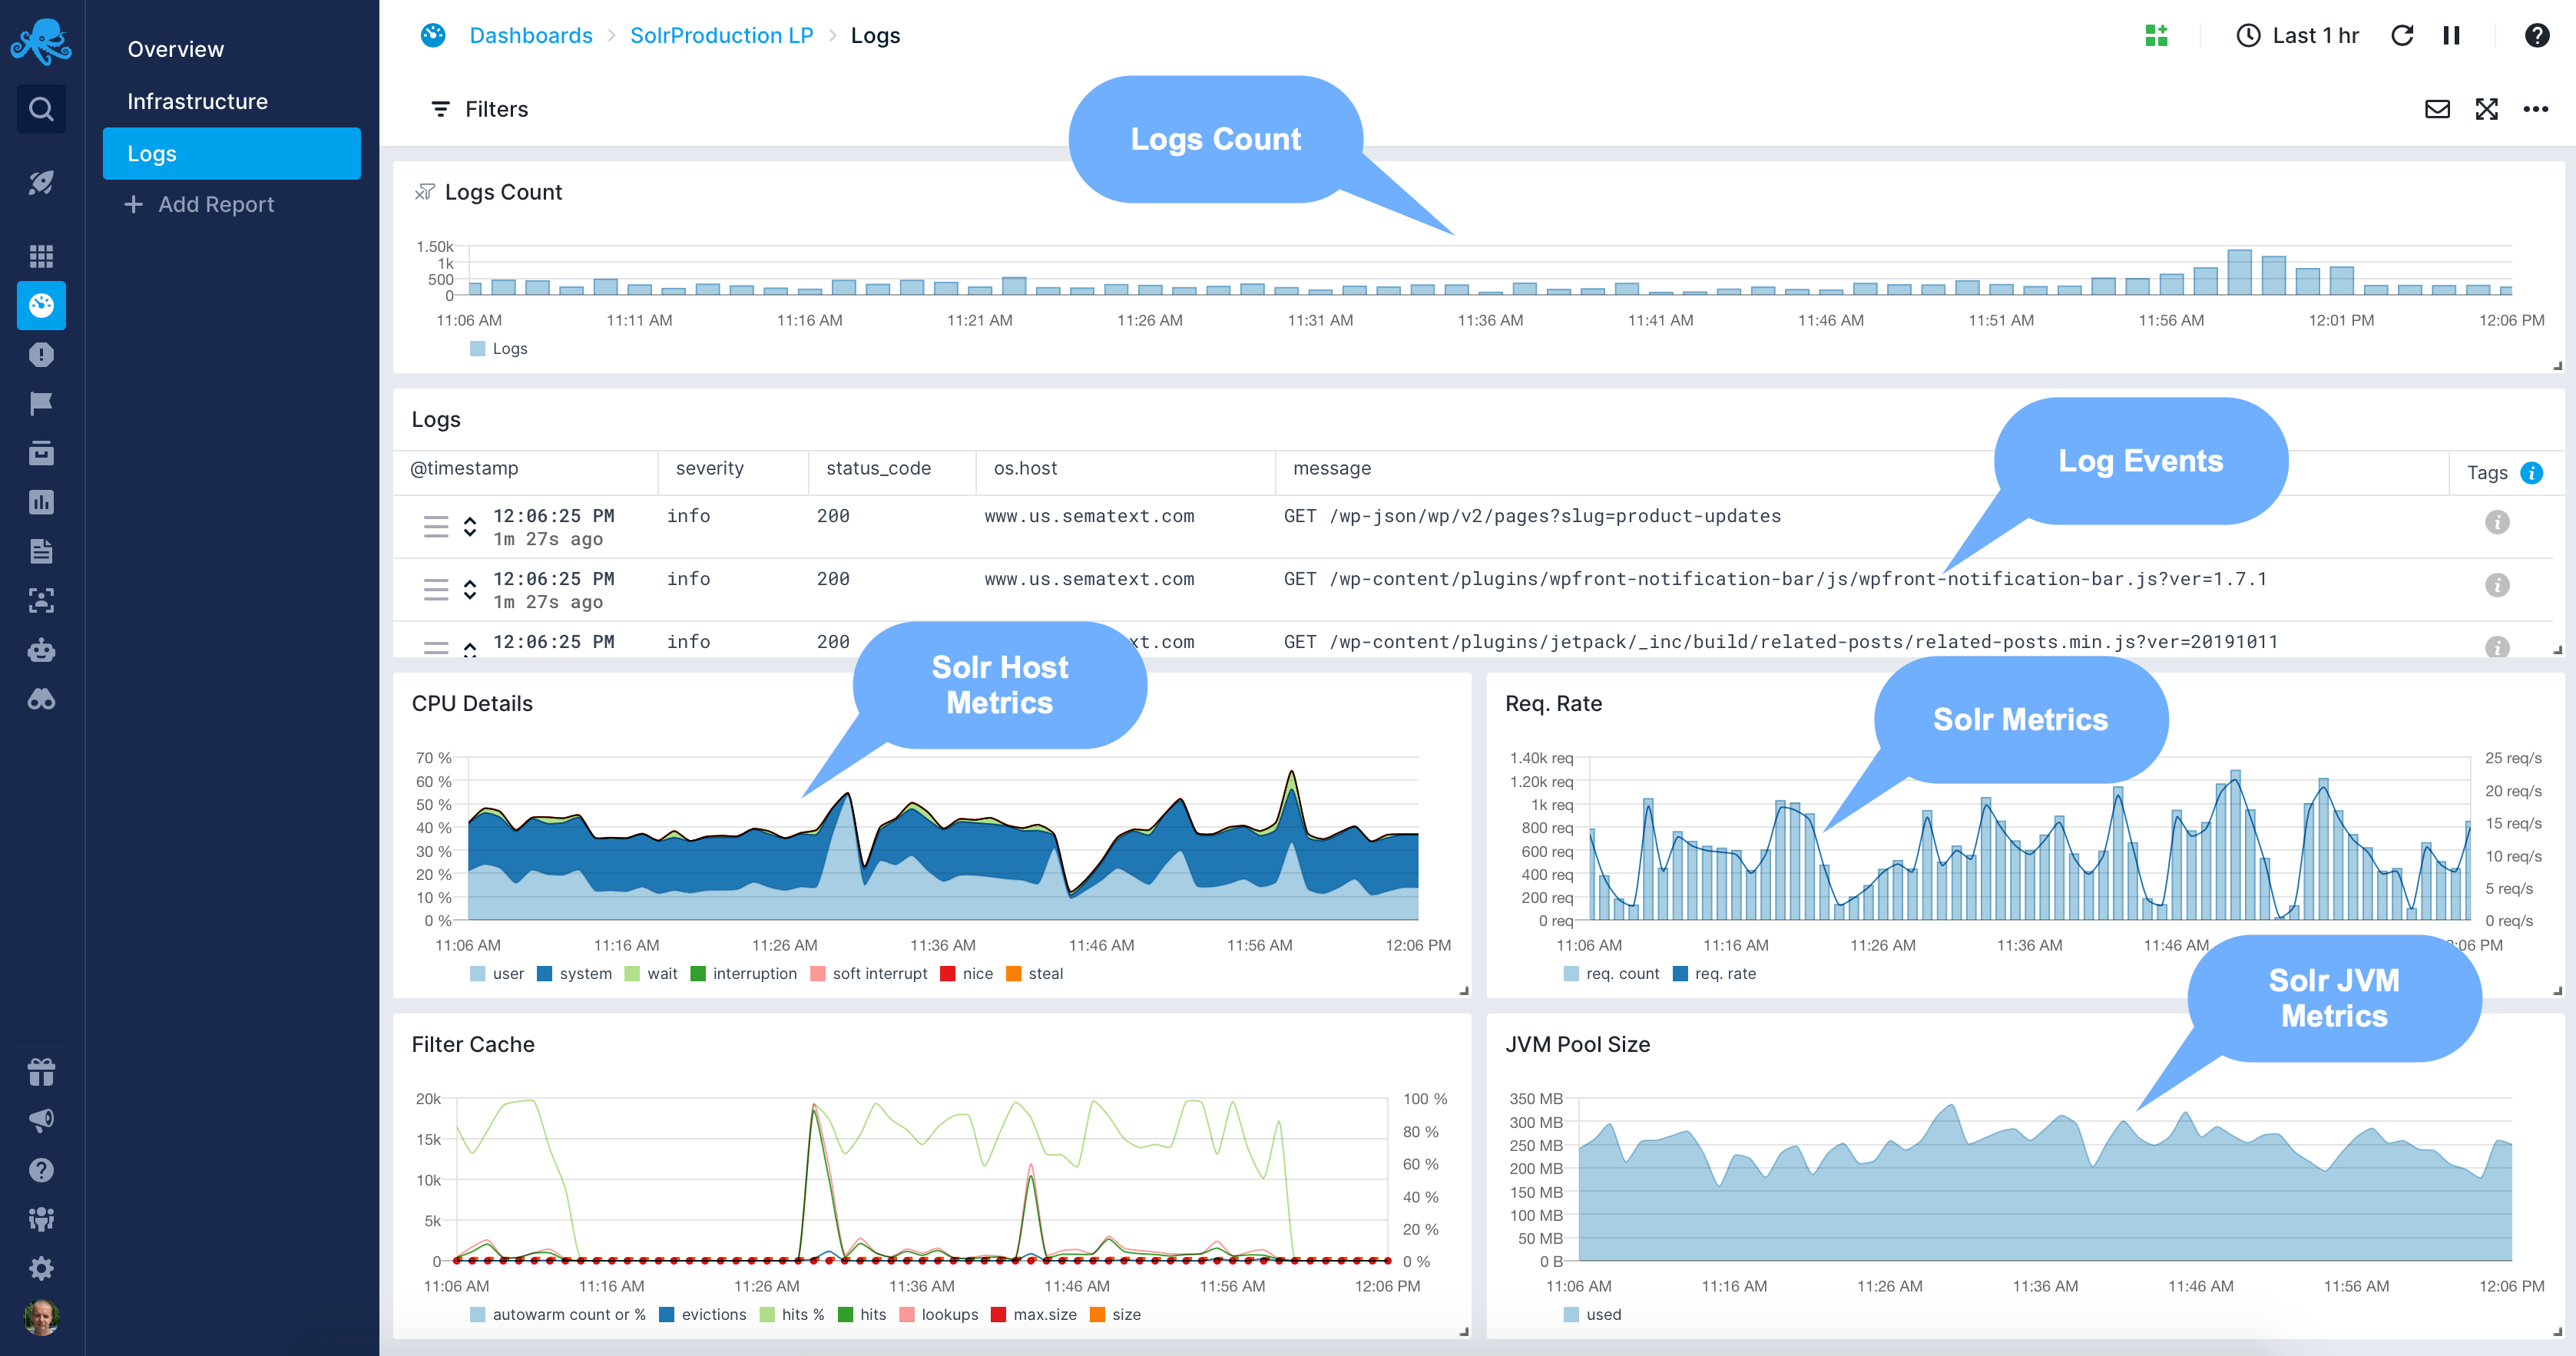
- Combine all metrics in a single place and correlate them with logs from your Solr servers
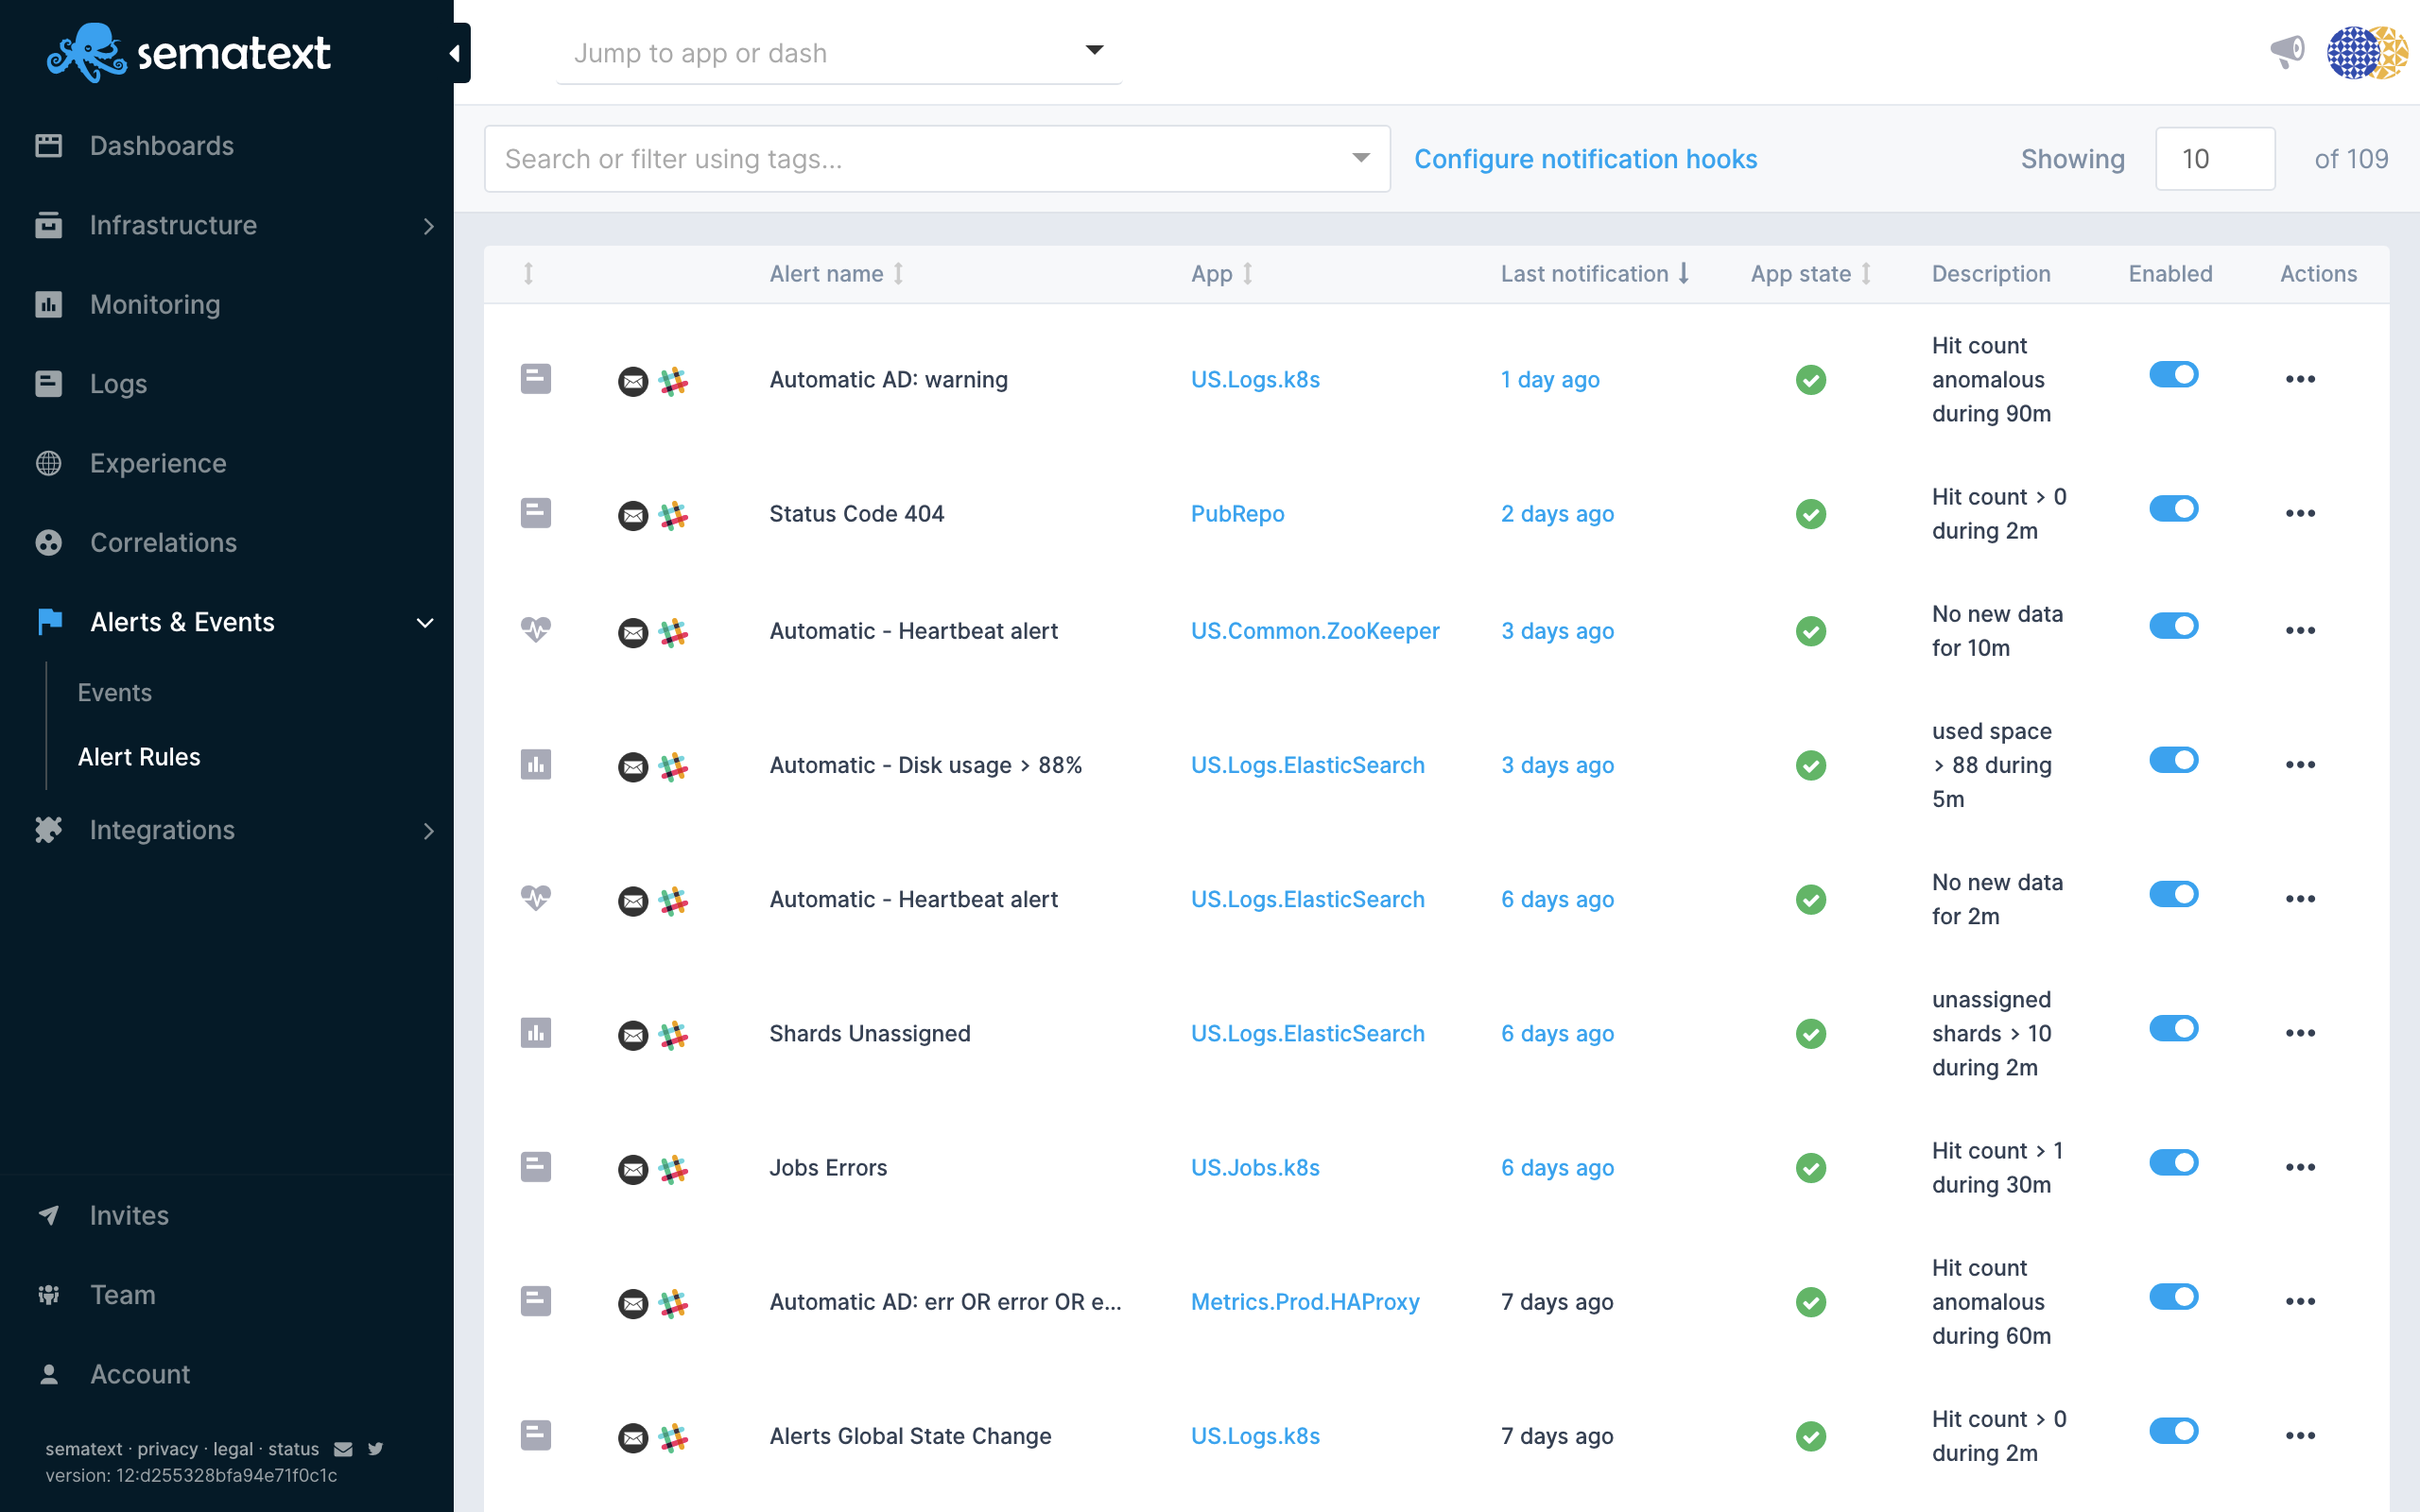
- Set up anomaly detection or threshold-based alerts on any combination of metrics and filters
- Sematext Agent auto-discovers, tags, and aggregates metrics from all Solr servers you want to monitor
10,000+ Companies trust Sematext
Sematext is great for monitoring SolrCloud, with out of the box dashboards and easy to setup alerts.
 Chris George
Manager, VIPConsult
Pre-Built and Custom Dashboard
- Benefit from out-of-the-box Solr monitoring dashboard with index statistics, request rate and latency, CPU utilization, JVM memory pool usage, filter, document and query result cache metrics, and more
- Add or remove widgets in existing reports for a custom dashboard
- Add a new report page with your favorite metrics charts and filters
Make Sense of Your Solr Logs in Seconds
- Auto-detect and parse Solr logs out-of-the-box; extensible with your own log parsing rules
- Route logs from different Solr instances to different destinations based on defined criteria
- Save frequently accessed views or create custom dashboards for better Solr insights
Notify Your DevOps Team about Critical Issues
- Share logs and metrics with your team using role-based access control
- Invite more team members by e-mail
- There is no limit on the number of users! Set up anomaly detection or threshold alerts
- Drill into logs to quickly troubleshoot critical issues