Find Performance Issues Faster
- Avoid blocking the thread and creating memory leaks
- Find the root cause of performance issues faster
- Use centralized logs with simple search syntax to drill down to the root cause even faster
- Combine metrics and logs to cut troubleshooting time in half
Get Started in Seconds
- Install the Agent
- Collect and store dozens of key metrics
- Collect and forward enriched logs
- Save views you use frequently
- Create individual dashboards to have better insights into your metrics and logs
10,000+ Companies trust Sematext
I must say very personal service and great product! I like the simplicity for the setup and how quick and responsive is the UI. It is like it was created from sys admins for sys admins.
 Chris George
Manager, VIPConsult
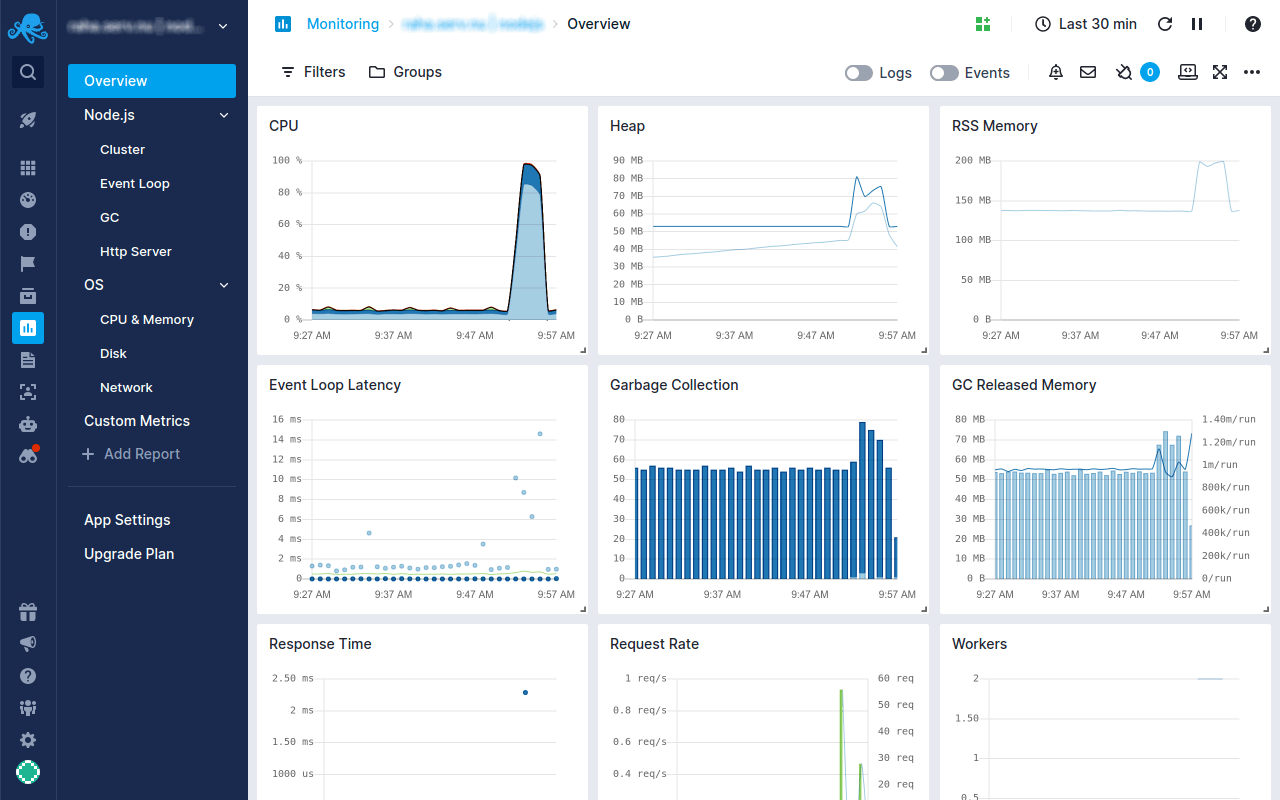
Pre-Built Dashboards
- Benefit from out-of-the-box Node.js monitoring dashboards with both host-specific metrics and Node.js metrics that also support Express.js
- Get insight into CPU, memory, swap, memory failed counters, network errors, disk IO, network traffic, and more
- Add or remove components and charts in existing reports to customize dashboards
- Add a new report page with your favorite metrics, charts, components, and filters
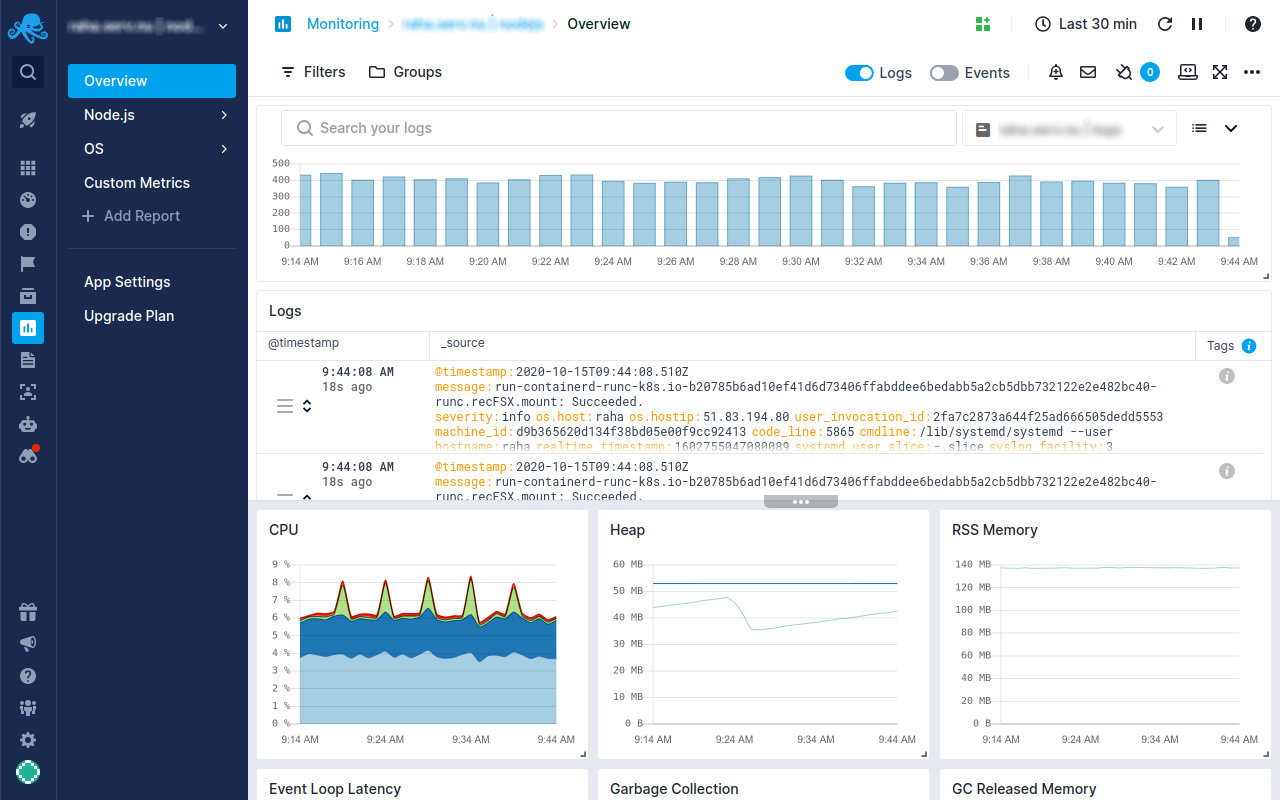
Real-Time Visibility into Your Node.js Processes and Infra
- Get a complete overview of all Node.js processes, threads, and workers
- Track memory usage and garbage collection cycles to avoid blocking the thread and creating memory leaks
- Add tags to logs to quickly filter and group between your applications and infra
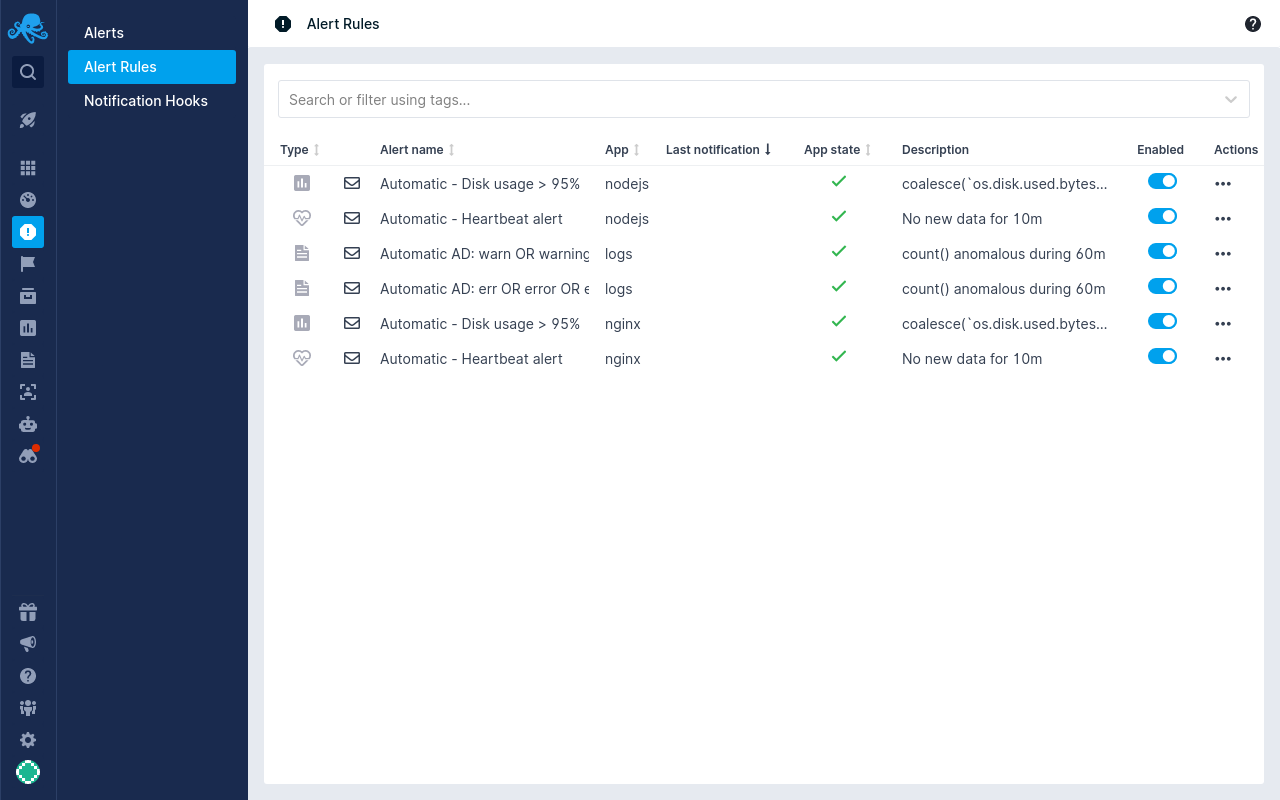
Notify Your DevOps Team About Critical Issues
- Share logs and metrics with your team using role-based access control
- Invite more team members by e-mail
- There is no limit on the number of users! Set up anomaly detection or threshold alerts
- Drill into logs to quickly troubleshoot critical issues