Cloud-Ready Integrations
- Get started in minutes with OOTB dashboards, alerts and anomaly detection rules
- Slice and dice by a number of context-aware filters
- Solr & SolrCloud, Elasticsearch, Kafka, Docker, Node.js, Express, Apache, MySQL, MariaDB, AWS EC2 ELB EBS RDS and more
- Cut down MTTR by spotting and troubleshooting infrastructure performance issues faster on-premise, in your cloud, or hybrid environments
10,000+ Companies trust Sematext
We looked into running our own Elastic Stack, and quickly realized that was a job and specialty within itself. We are a small startup and every dollar counts. Wasting precious and expensive sysadmin time on managing things far out of our project scope really isn’t an option.
 Zach Aufort
BlockGen CEO
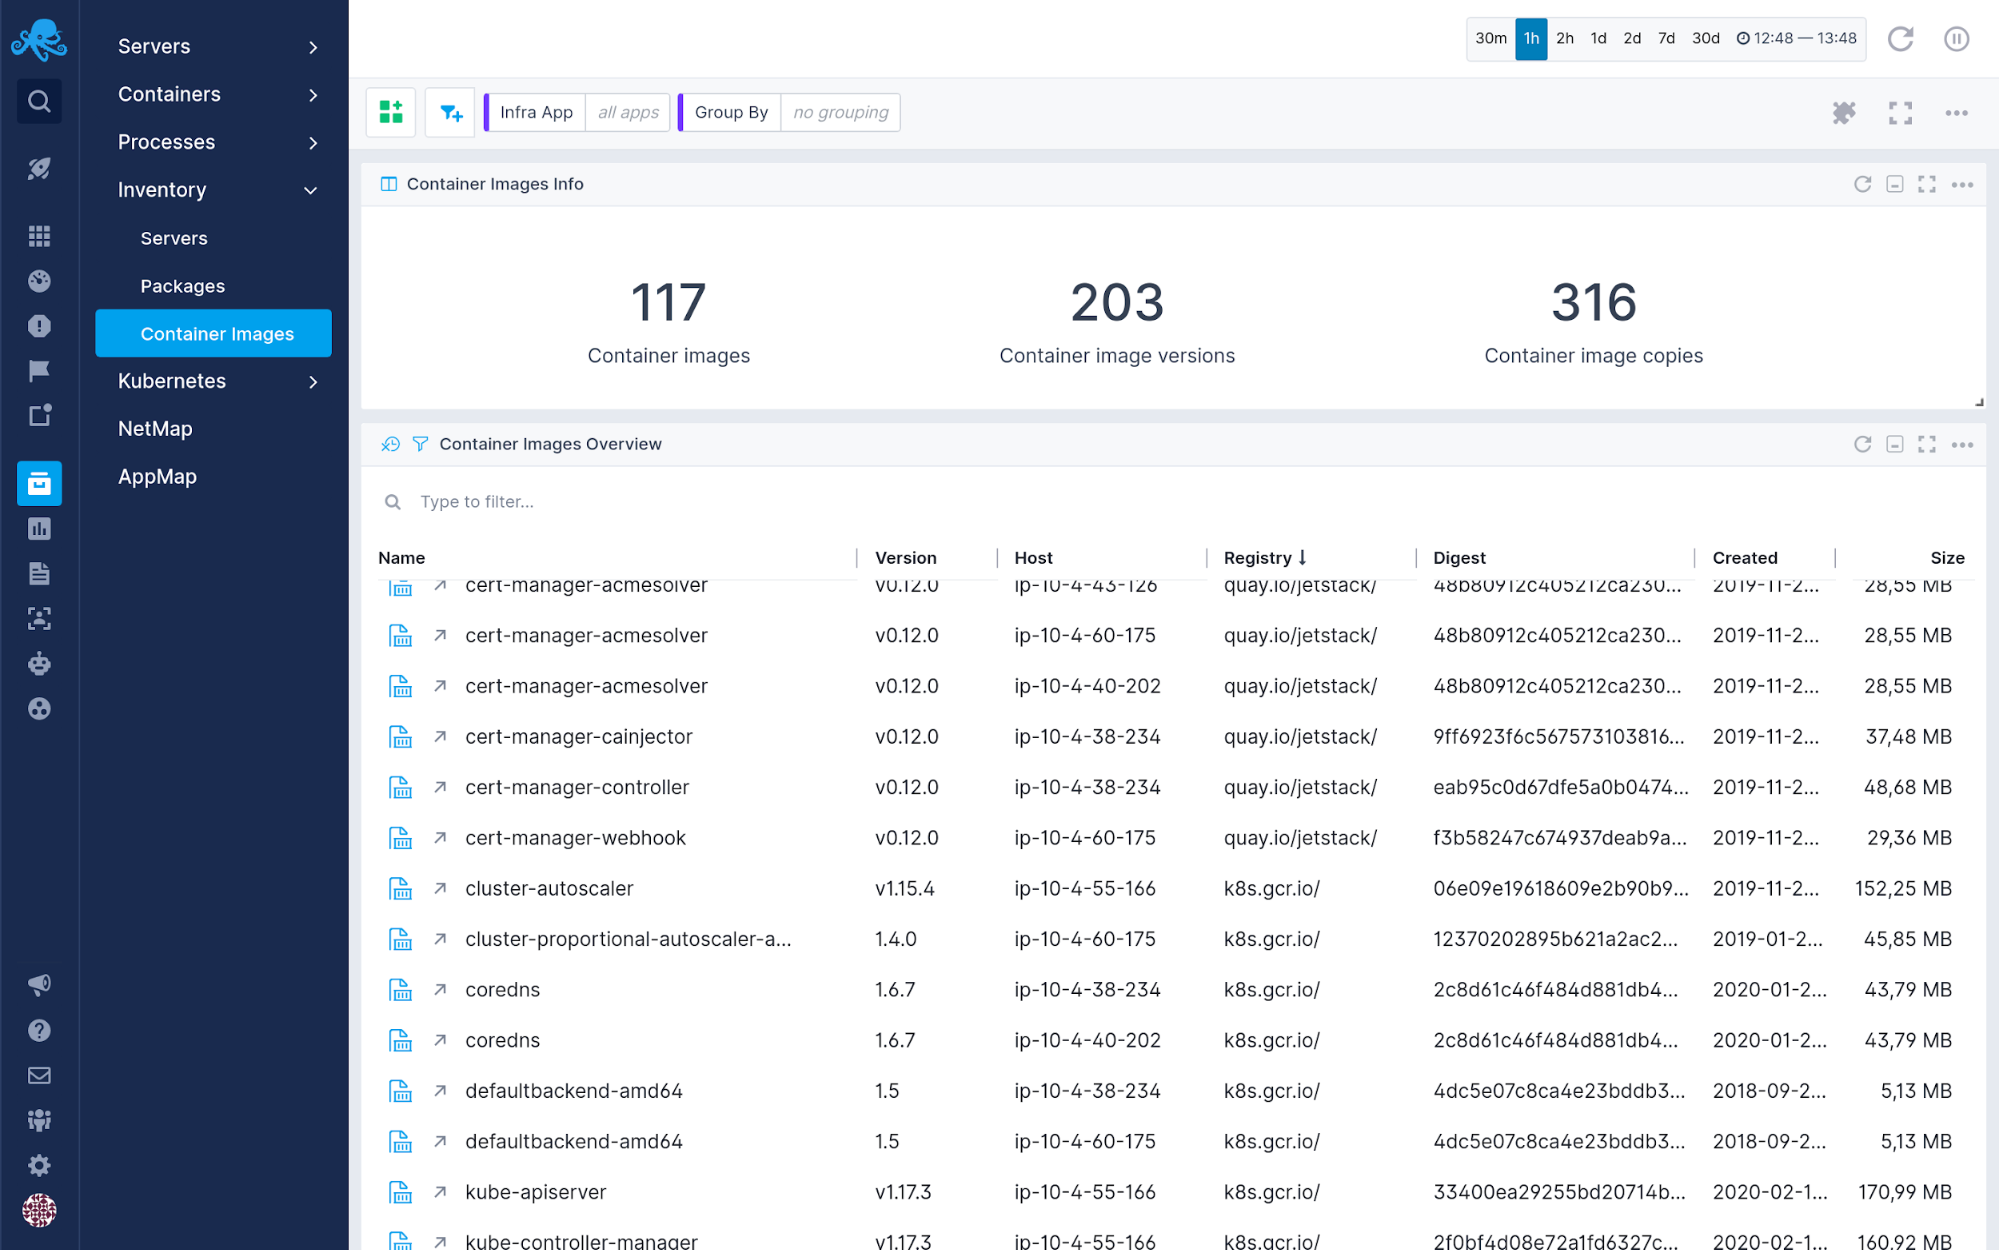
Inventory Monitoring
- Capture all package installation, update, and removal events details
- Quickly find all servers or containers with vulnerable packages
- Compare any two machines and find mismatched packages
- Search, filter and group packages, machines, and other inventory data
- Group infrastructure into distinct sets to quickly identify misconfigured infrastructure
- Collect machine metadata
- Track all hardware configurations
Cloud & Container Monitoring
- See container-specific metrics & correlate container metrics and logs for faster troubleshooting
- Get logs parsed, structured, enriched, masked, and more for flexible reporting and fast search
- Alert on any Docker host or container metric or log pattern
- Visualize Docker data in real-time
Database Monitoring
- Get a complete overview of your MySQL or MariaDB health whether you are running databases on your own infrastructure or using Amazon RDS.
- Connection details (used connections, aborted clients…)
- Traffic in and out of DB, queries/questions details, slow queries count, select/sort usage stats
- Detailed MyISAM and InnoDB engines stats
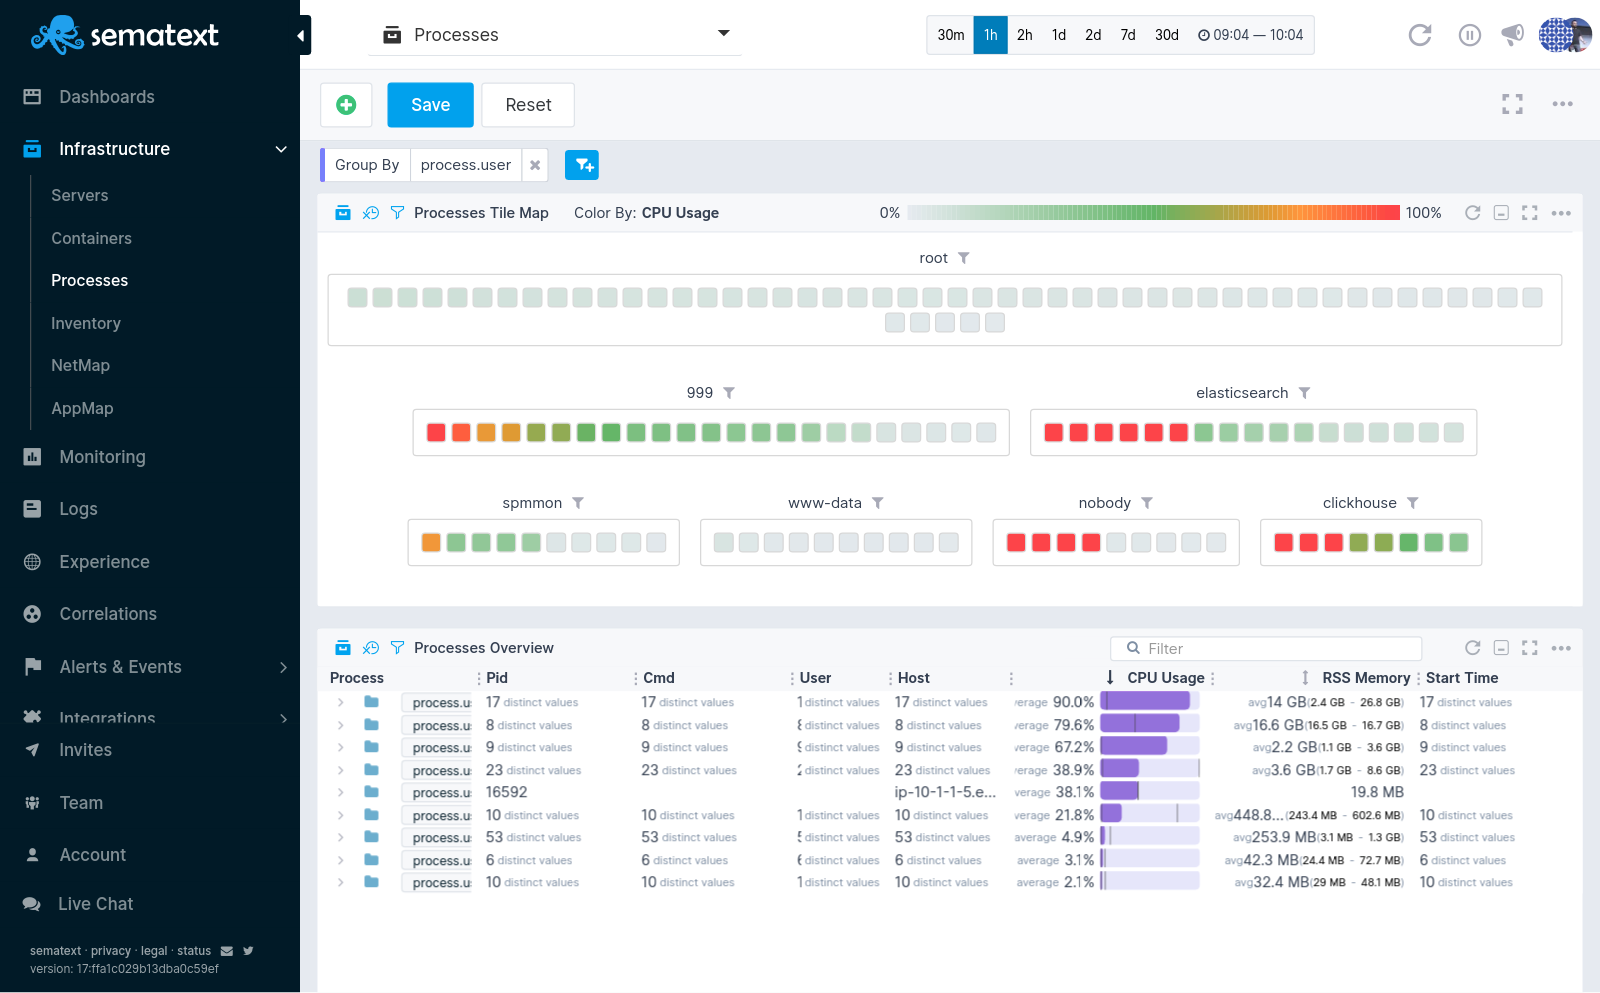
Transaction Tracing
- Find slow database operations
- View full SQL statements
- See end-to-end HTTP transaction context, through multiple tiers, including full call traces
- Get top 10 operations by throughput, latency, or time consumed
- Filter database operations by type
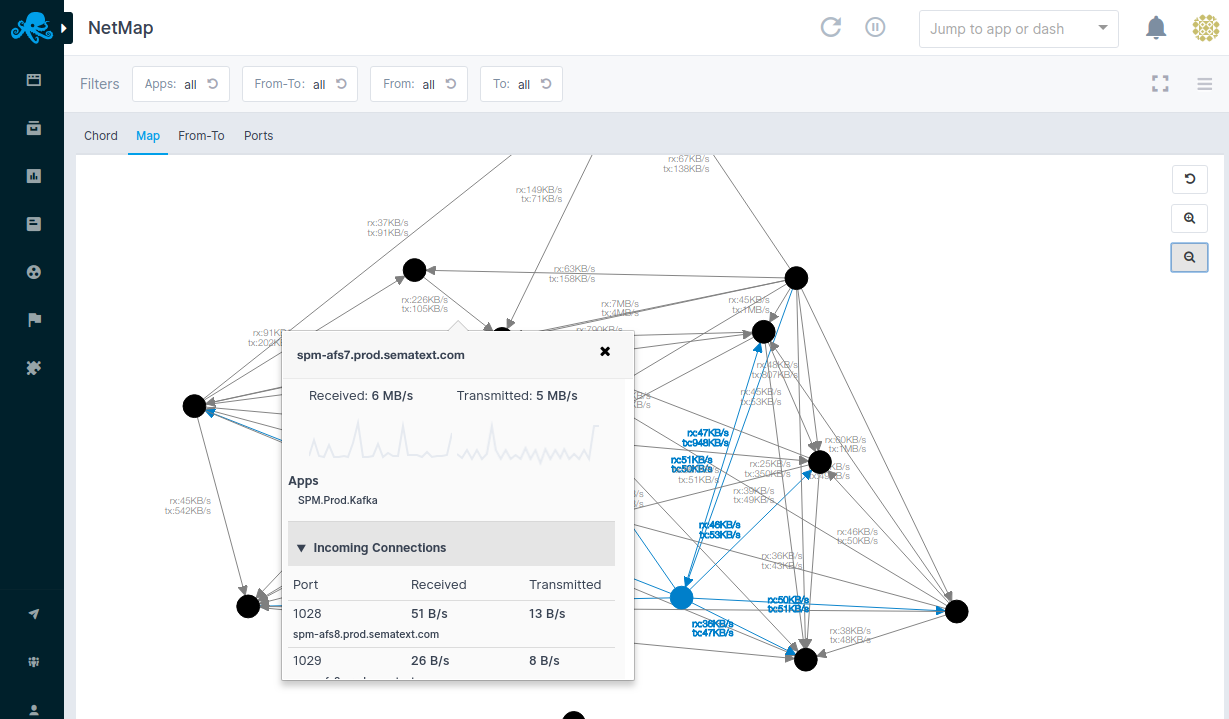
Network Monitoring
- View your complete infrastructure as a dynamic network map or NetMap
- Perform network performance monitoring with real-time receive and transmit rates and ports used for communication
- Explore multiple map views with zooming, panning, and filtering
- Control monitored network interfaces and filter out uninteresting endpoints
Bring your Logs and Metrics under One Roof
- Sematext Cloud brings together real-time performance monitoring, log management, user monitoring, alerts, and events to provide you unprecedented visibility of your dynamic infrastructure
- Alert on metrics & logs (Threshold, Anomaly detection)
APIs and Custom Metrics
- Open HTTP APIs let you ship Custom Metrics from your apps
- Instrument your apps and send custom metrics
- Capture and send app, business, and other events
- Open-source metrics libraries for Java, Ruby, and Node.js
- Use APIs for alert automation and more