Looking to learn about Logstash as quickly as possible? This Logstash Tutorial is for you: we’ll install Logstash and push some Apache logs to Elasticsearch in less than 5 minutes.
1. The Basics: What Is Logstash and How Does It Work?
Logstash is a free and open source data collection engine that reads data from a variety of sources, processes it, then sends it to one or more destinations, the most popular one being Elasticsearch. It’s also one of the easiest log management tools to get started with (so it’s perfect for beginners), which is exactly what this guide is about.
Once logs are structured and stored in Elasticsearch, you can start searching and visualizing with Kibana, completing the Elastic Stack (formerly known as ELK Stack).
Use Logstash to send logs to Sematext Logs, our log management & analysis solution. Get Started
2. Installing and Running Logstash
After you download Logstash (careful which version you are downloading – there is the Apache Software License version of Elastic License version. The former is free.), you’d start it with bin/logstash -f config_file.conf. If you choose the RPM/DEB package, you’d put the config file in /etc/logstash/conf.d/ and start Logstash via service logstash start.
3. Logstash Configuration & Quick Example
In less than 5 minutes, you’ll learn how to set up Logstash, send logs from a file, parse them to extract metrics from those logs and send them to Sematext Logs, our hosted ELK logging service. Don’t worry, because Sematext Logs exposes the Elasticsearch API, the same steps will work if you have a local Elasticsearch cluster.
Further reading: If you don’t end up liking Logstash be sure to check out our Logstash alternatives article, one of them being Logagent – if Logstash is easy, Logagent really gets you started in a minute.
SIDE NOTE: We run Elasticsearch and ELK trainings, which may be of interest to you and your teammates.
3.1. Overview
As an example, we’ll take an Apache log, written in its combined logging format. Your Logstash configuration would be made up of three parts:
- a file input, that will follow the log
- a grok filter, that would parse its contents to make a structured log
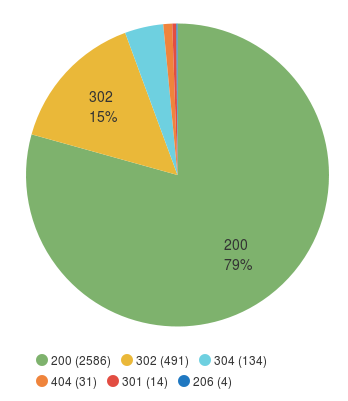
- an elasticsearch output, that will send your logs to Sematext via HTTP. For example, with Kibana you can make a pie-chart of response codes:
3.2. Logstash File Input
The first part of your configuration file would be about your inputs. Inputs are Logstash plugins responsible for ingesting data. You can use the file input to tail your files. There are a lot of options around this input, and the full documentation can be found here.
For now, let’s assume you want to send the existing contents of that file, in addition to the new content. To do that, you’d set the start_position to the beginning. Here’s how the whole input configuration will look like:
input {
  file {
    path => "/var/log/apache.log"
    type => "apache-access"  # a type to identify those logs (will need this later)
    start_position => "beginning"
  }
}
3.3. Logstash Grok Filter
Filters are modules that can take your raw data and try to make sense of it. Logstash has lots of such plugins, and one of the most useful is grok. Grok makes it easy for you to parse logs with regular expressions, by assigning labels to commonly used patterns. One such label is called COMBINEDAPACHELOG, which is exactly what we need:
filter {
  if [type] == "apache-access" {   # this is where we use the type from the input section
    grok {
      match => [ "message", "%{COMBINEDAPACHELOG}" ]
    }
  }
}
If you need to use more complicated grok patterns, we suggest trying the grok debugger.
Further reading:
Looking to replace Splunk or a similar commercial solution with Elasticsearch, Logstash, and Kibana (aka, “ELK stack” or “Elastic stack”) or an alternative logging stack? In this eBook, you’ll find useful how-to instructions, screenshots, code, info about structured logging with rsyslog and Elasticsearch, and more.
Download yours
3.4. Logstash Elasticsearch Output
To send logs to Sematext Logs (or your own Elasticsearch cluster) via HTTP, you can use the elasticsearch output. You’ll need to specify that you want the HTTP protocol, the host and port of an Elasticsearch server.
For Sematext Logs, those would be logsene-receiver.sematext.com and port 443. Another Sematext Logs-specific requirement is to specify the access token for your Sematext Logs app as the Elasticsearch index. (Stylerecap) You can find that token in your Sematext account, under Logs ⇒ All Logs Apps.
The complete output configuration would be:
output {
  elasticsearch {
    hosts => "logsene-receiver.sematext.com:443" # it used to be "host" and "port" pre-2.0
    ssl => "true"
    index => "your Logsene app token goes here"
    manage_template => false
    #protocol => "http" # removed in 2.0
    #port => "443" # removed in 2.0
  }
}
Further reading:
- Sending your Windows Event Logs to Sematext using NxLog and Logstash
- Logstash Multiline Events: How to Handle Stack Traces
- Elasticsearch vs Logstash Performance: Testing Ingest Node
- Recipe: Reindexing Elasticsearch Documents with Logstash
Wrapping Up
Don’t forget to download your Quick Guide to Logging Basics.
With your logs in Elasticsearch, you can download Kibana, point it to your Elasticsearch (elasticsearch.url in config/kibana.yml) and start it via bin/kibana.
If you’re using Sematext Logs, our log managament tools, you can simply go to your Logs App and start exploring logs through either the native UI or Kibana. Remember, Sematext Logs is free to play with and it frees you up from having to manage your own Elasticsearch cluster.
NOTE: If this sort of stuff excites you, we are hiring worldwide for positions from DevOps and core product engineering to marketing and sales.