Raise your hand if you’ve never experienced the dreaded Java OutOfMemoryError (aka OOM or OOME) while working with Java. If you’ve raised your hand count yourself lucky. The vast majority of Java developers are nowhere near that lucky. Today, SPM is making the lives of all Java developers a little better by adding JVM Memory Pool Monitoring reports to SPM to the existing JVM Heap, JVM Threads, and Garbage Collection reports. Note: you’ll need to get the new SPM client (version 1.16 or newer) to see these reports.
Please tweet about JVM Memory Pool Monitoring in SPM
What are JVM Memory Pools (aka Spaces)
The super simplified version of this complex topic is that inside the JVM there are different memory pools (aka spaces) that the JVM uses for different types of objects. The JVM uses some of these pools to store permanent bits, others for storing young objects, others for storing tenured objects, and so on. Numerous blog posts and documentation has been written on the topic of the inner workings of the JVM. It’s a complex topic that is not easy to fully grook in one sitting. To make the story more complex, different Garbage Collectors and certainly different JVM implementations manage objects differently. Thus, which exact memory pools you see in SPM will depend and change as you change the JVM or select a different garbage collection algorithms or garbage collection-related parameters. And this is precisely one case where seeing these pools in SPM comes reeeeeally handy – seeing how memory pool sizes and usage changes as you try different Garbage Collectors or any other JVM parameter can be very informative, educational, and can bring insight into the workings of the JVM that let you select parameters that are optimal for your particular application.
The new JVM Memory Pools reports are available to all SPM users right away. Let’s have a look at what these new reports look like and what information they provide.
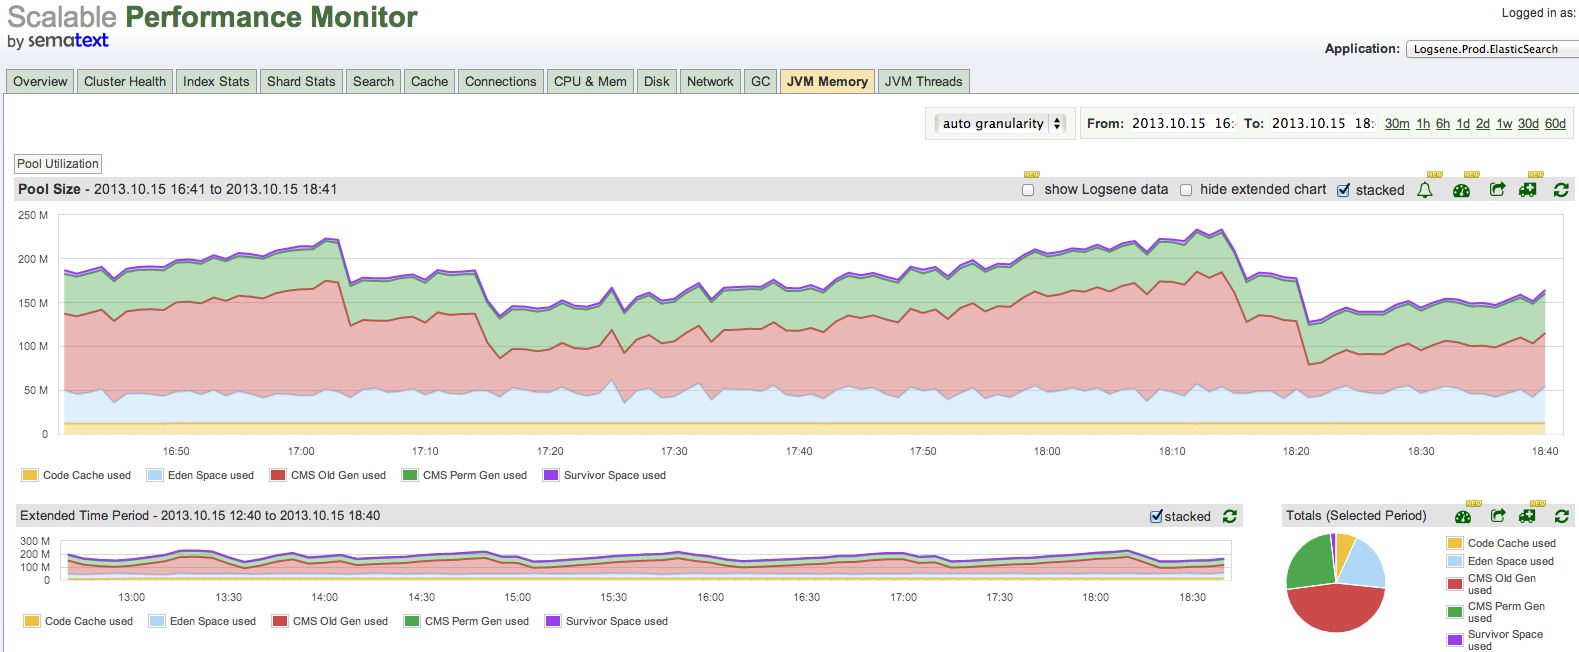
Memory Pool Sizes
This report should be obvious to all Java developers who know about how JVM manages memory. Here we see relative sizes of all memory spaces and their total size. If you are troubleshooting performance of the JVM (i.e., any Java application) this is one of the key places to check first, in addition to looking at Garbage Collection and Memory Pool Utilization report (see further below). In this graph we see a healthy sawtooth pattern clearly showing when major garbage collection kicked in.

Memory Pool Utilization
The Memory Pool Size graph is useful, but knowing the actual utilization of each pool may be even more valuable, especially if you are troubleshooting the OutOfMemoryError we mentioned earlier in the post. Java OOME stack traces don’t often tell you much info about where the OOME happened. The Memory Pool Utilization graph shows what percentage of each pool is being used over time. When some of these Memory Pools approach 100% utilization and stay there, it’s time to worry. When that happens, if you jump over to the Garbage Collection report in SPM you will probably see spikes there as well. And if you then jump to your CPU report in SPM you will likely see increased CPU usage there, as the JVM keeps trying to free up some space in any pools that are (nearly) full.

Alerting for Memory Pool before OOME
If you see scary spikes or near 100% utilization of certain memory pools, your application may be in trouble. Not dealing with this problem, whether through improving the application’s use of memory or giving the JVM more memory via -Xmx and related parameters, will likely result in a big bad OOME. Nobody wants that to happen. One way to keep an eye on this is via Alerts in SPM. As you can see from the graphs, memory utilization naturally and typically varies quite a bit. Thus, although SPM has nice Algolerts, to monitor utilization of JVM memory pools we recommend using standard threshold-based Alerts and getting alerted when utilization percentage is > N% for M minutes. N and M are up to you, of course.
Please tell us what you think – @sematext is always listening! Is there something SPM doesn’t monitor that you would really like to monitor? Please vote for tech to monitor!