Working with Java applications has a lot of benefits. Especially when compared to languages like C/C++. In the majority of cases, you get interoperability between operating systems and various environments. You can move your applications from server to server, from operating system to operating system, without major effort or in rare cases with minor changes.
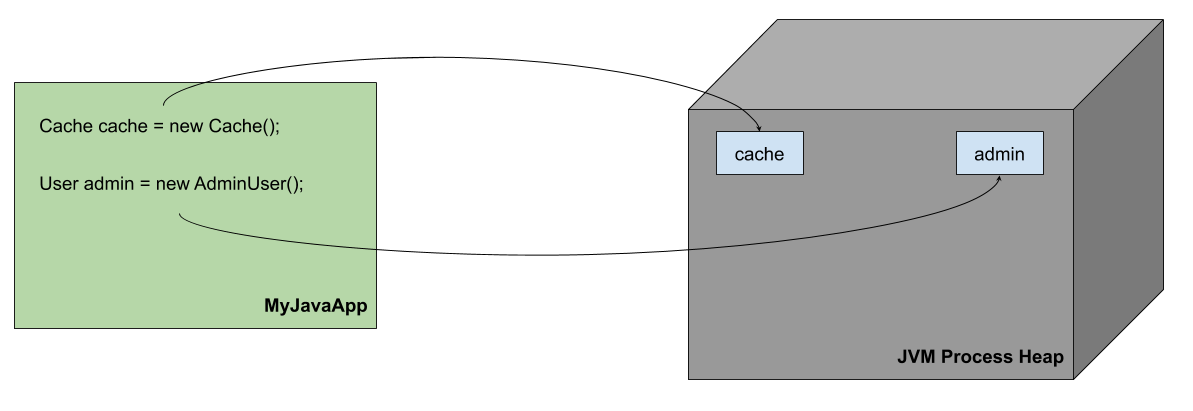
One of the most interesting benefits of running a JVM-based application is automatic memory handling. When you create an object in your code it is assigned on a heap and stays there until it is referenced from the code. When it is no longer needed it needs to be removed from the memory to make room for new objects. In programming languages like C or C++, the cleaning of the memory is done by us, programmers, manually in the code. In languages like Java or Kotlin, we don’t need to take care of that – it is done automatically by the JVM, by its garbage collector.
What Is Garbage Collection Tuning
Garbage Collection GC tuning is the process of adjusting the startup parameters of your JVM-based application to match the desired results. Nothing more and nothing less. It can be as simple as adjusting the heap size – the -Xmx and -Xms parameters. Which is by the way what you should start with. Or it can be as complicated as tuning all the advanced parameters to adjust the different heap regions. Everything depends on the situation and your needs.
With Sematext you can track garbage collection counts, duration and sizes out of the box.
Try it free for 14 days See our plans
No credit card required – Get started in seconds
Why Is Garbage Collection Tuning Important
Cleaning our applications’ JVM process heap memory is not free. There are resources that need to be designated for the garbage collector so it can do its work. You can imagine that instead of handling the business logic of our application the CPU can be busy handling the removal of unused data from the heap.
This is why it’s crucial for the garbage collector to work as efficiently as possible. The GC process can be heavy. During our work as developers and consultants, we’ve seen situations where the garbage collector was working for 20 seconds during a 60-second window of time. Meaning that 33% of the time the application was not doing its job — it was doing the housekeeping instead.
We can expect JVM threads to be stopped for very short periods of time. It happens constantly:
2019-10-29T10:00:28.879-0100: 0.488: Total time for which application threads were stopped: 0.0001006 seconds, Stopping threads took: 0.0000065 seconds
What’s dangerous, however, is a complete stop of the application threads for a very long period of time – like seconds or in extreme cases even minutes. This can lead to your users not being able to properly use your application at all. Your distributed systems can collapse because of elements not responding in a timely manner.
To avoid that we need to ensure that the garbage collector that is running for our JVM applications is well configured and is doing its job as well as it can.
When to Do Garbage Collection Tuning
The first thing that you should know is that tuning the garbage collection should be one of the last operations you do. Unless you are absolutely sure that the problem lies in the garbage collection, don’t start with changing JVM options. To be blunt, there are numerous situations where the way how the garbage collector works only highlights a bigger problem.
If your JVM memory utilization looks good and your garbage collector works without causing trouble, you shouldn’t spend time turning your garbage collection. You will most likely be more effective in refactoring the code to be more efficient.
So how do we say that the garbage collector does a good job? Your Java monitoring tool will provide you information regarding your JVM metrics, including its memory utilization, the garbage collector work, and of course the overall performance of your application. For example, have a look at the following chart:
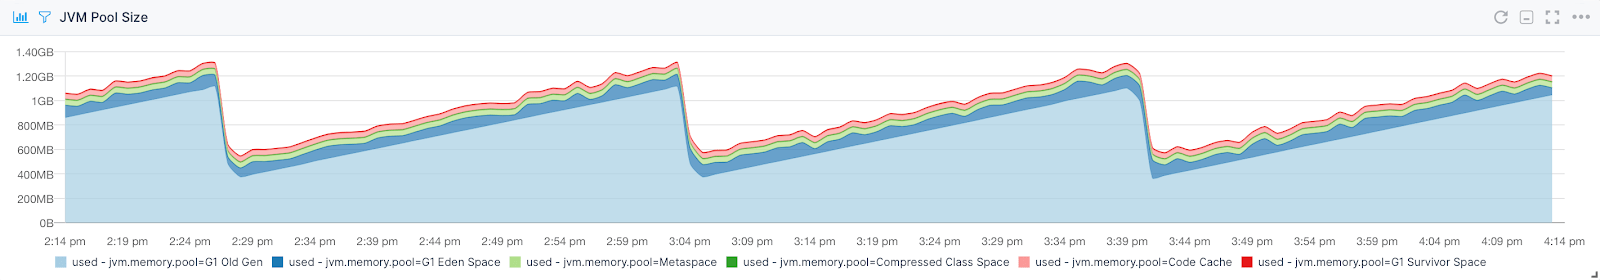
In this chart, you can see something called “shark tooth”. Usually, it is a sign of a healthy JVM heap. The largest portion of the memory, called the old generation, gets filled up and then is cleared by the garbage collector. If we would correlate that with the garbage collector timings we would see the whole picture. Knowing all of that we can judge if we are satisfied with how the garbage collection is working or if tuning is needed.
Another thing you can look into is garbage collection logs that we discussed in the previous blog post about how to analyze Java garbage collections. You can also use tools like jstat or any Java profiler. They will give you detailed information regarding what’s happening inside your JVM, especially when it comes to heap memory and garbage collection.
There is also one more thing that you should consider when thinking about garbage collection performance tuning. The default Java garbage collection settings may not be perfect for your application, so to speak. Meaning, instead of going for more hardware or for more beefy machines you may want to look into how your memory is managed. Sometimes tuning can decrease the operation cost lowering your expenses and allowing for growth without growing the environment.
Once you are sure that the garbage collector is to blame and you want to start optimizing its parameters we can start working on the JVM startup parameters.
Garbage Collection Tuning Procedure: How to Tune Java GC
When talking about the procedure you should take when tuning the garbage collector you have to remember that there are more garbage collectors available in the JVM world. When dealing with smaller heaps and older JVM versions, like version 7, 8, or 9, you will probably use the good, old Concurrent Mark Sweep garbage collector for your old generation heap. With a newer version of the JVM, like 11, you are probably using G1GC. If you like experimenting you are probably using the newest JVM version along with ZGC. You have to remember that each garbage collector works differently. Hence, the tuning procedure for them will be different.
Running a JVM-based application with different garbage collectors is one thing, doing experiments is another. Java garbage collection tuning will require lots of experiments and tries. It’s normal that you won’t achieve the desired results in your first try. You will want to introduce changes one by one and observe how your application and the garbage collector behave after each change.
Whatever your motivation for GC tuning is I would like to make one thing clear. To be able to tune the garbage collector, you need to be able to see how it works. This means that you need to have visibility into GC metric or GC logs, or both, which would be the best solution.
Starting GC Tuning
Start by looking at how your application behaves, what events fill up the memory space, and what space is filled. Remember that:
- Assigned objects in the Eden generation are moved to Survivor space
- Assigned objects in the Survivor space are moved to Tenured generation if the counter is high enough or the counter is increased.
- Assigned objects in the Tenured generation are ignored and will not be collected.
You need to be sure you understand what is happening inside your application’s heap, and keep in mind what causes the garbage collection events. That will help you understand your application’s memory needs and how to improve garbage collection.
Let’s start tuning.
Heap Size
You would be surprised how often setting the correct heap size is overlooked. As consultants, we’ve seen a few of those, believe us. Start by checking if your heap size is really well set up.
What should you consider when setting up the heap for your application? It depends on many factors of course. There are systems like Apache Solr or Elasticsearch which are heavily I/O dependent and can share the operating system file system cache. In such cases, you should leave as much memory as you can for the operating system, especially if your data is large. If your application processes a lot of data or does a lot of parsing, larger heaps may be needed.
Anyways, you should remember that until 32GB of heap size you benefit from so-called compressed ordinary object pointers. Ordinary object pointers or OOP are 64-bits pointers to memory. They point to memory allowing the JVM to reference objects on the heap. At least this is how it works without getting deep into the internals.
Up to 32GB of the heap size, JVM can compress those OOPs and thus save memory. This is how you can imagine the compressed ordinary object pointer in the JVM world:
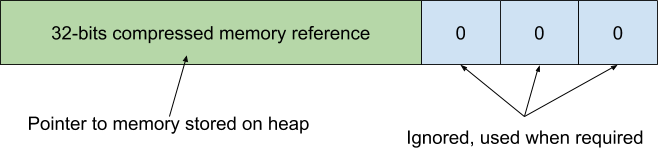
The first 32 bits are used for the actual memory reference and are stored on the heap. 32 bits is enough to address every object on heaps up to 32GB. How do we calculate that? We have 232 – our space that can be addressed by a 32-bits pointer. Because of the three zeros in the tail of our pointer we have 232+3, which gives us 235, so 32GB of memory space that can be addressed. That’s the maximum heap size we can use with compressed ordinary object pointers.
Going above 32GB of the heap will result in JVM using 64-bits pointers. In some cases going from 32GB to 35GB heap, you are likely to have more or less the same amount of usable space. That depends on your application memory usage, but you need to take that into consideration and probably go above 35GB to see the difference.
Finally, how do I choose the proper heap size? Well, monitor your usage and see how your heap behaves. You can use your monitoring for that, like Sematext’s JVM monitoring tool:
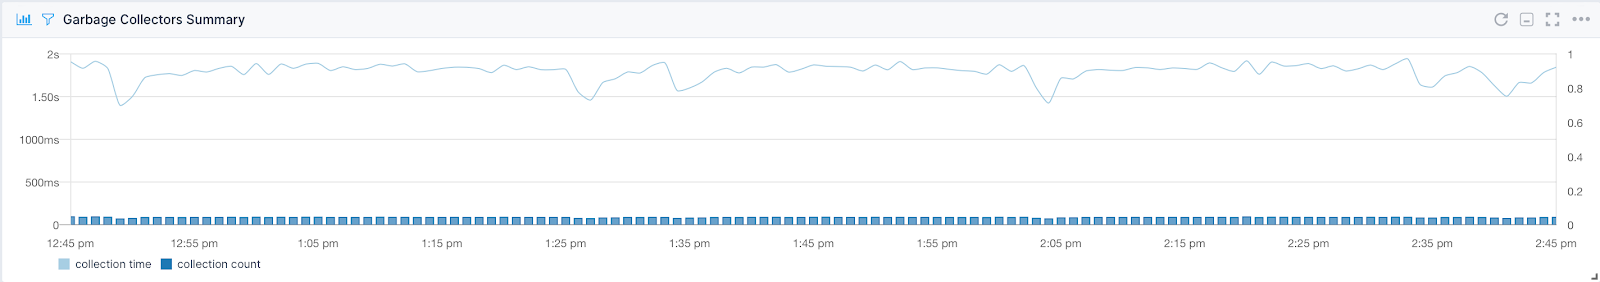
You can see the JVM pool size and the GC summary charts. As you can see the JVM heap size can be characterized as shark teeth – a healthy pattern. Based on the first chart we can that we need at least 500 – 600MB of memory for that application. The point where the memory is evacuated is around 1.2GB of the total heap size, for the G1 garbage collector, in this case. In this scenario, we have the garbage collector running for about 2 seconds in the 60 seconds time period, which means that the JVM spends around 2% of the time in garbage collection. This is good and healthy.
We can also look at the average garbage collection time along with the 99th and 90th percentile:
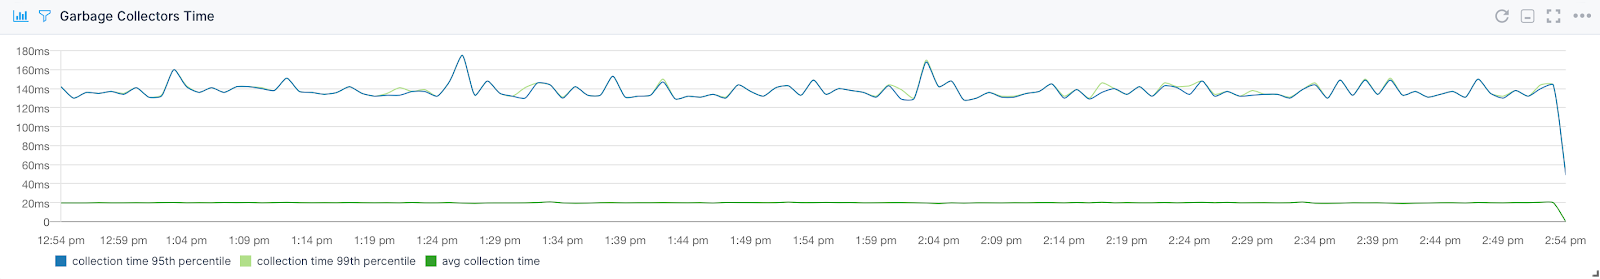
Based on that information we can see that we don’t need a higher heap. Garbage collection is fast and efficiently clears the data.
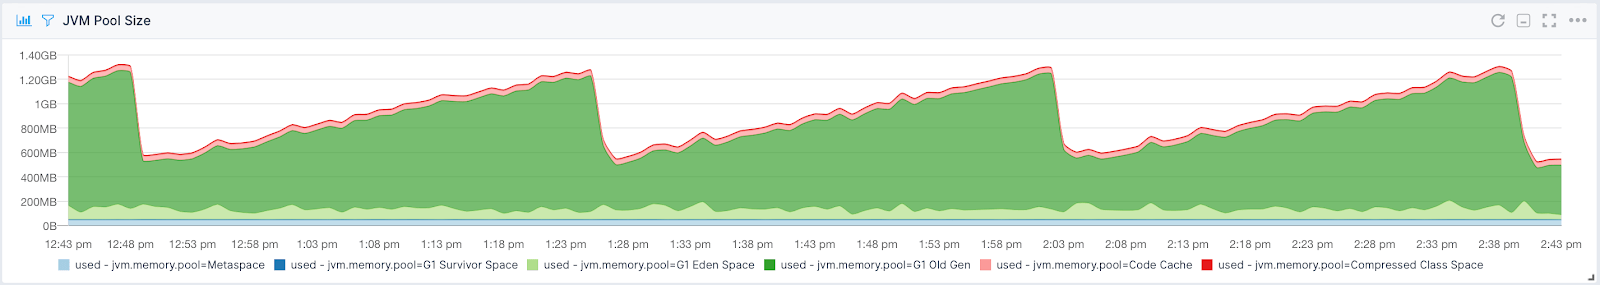
On the other hand, if we know that our application is used and processes data, its heap is above 70 – 80% of the maximum heap that we set it to and we would see GC struggling we know that we are in trouble. For example, look at this application’s memory pools:
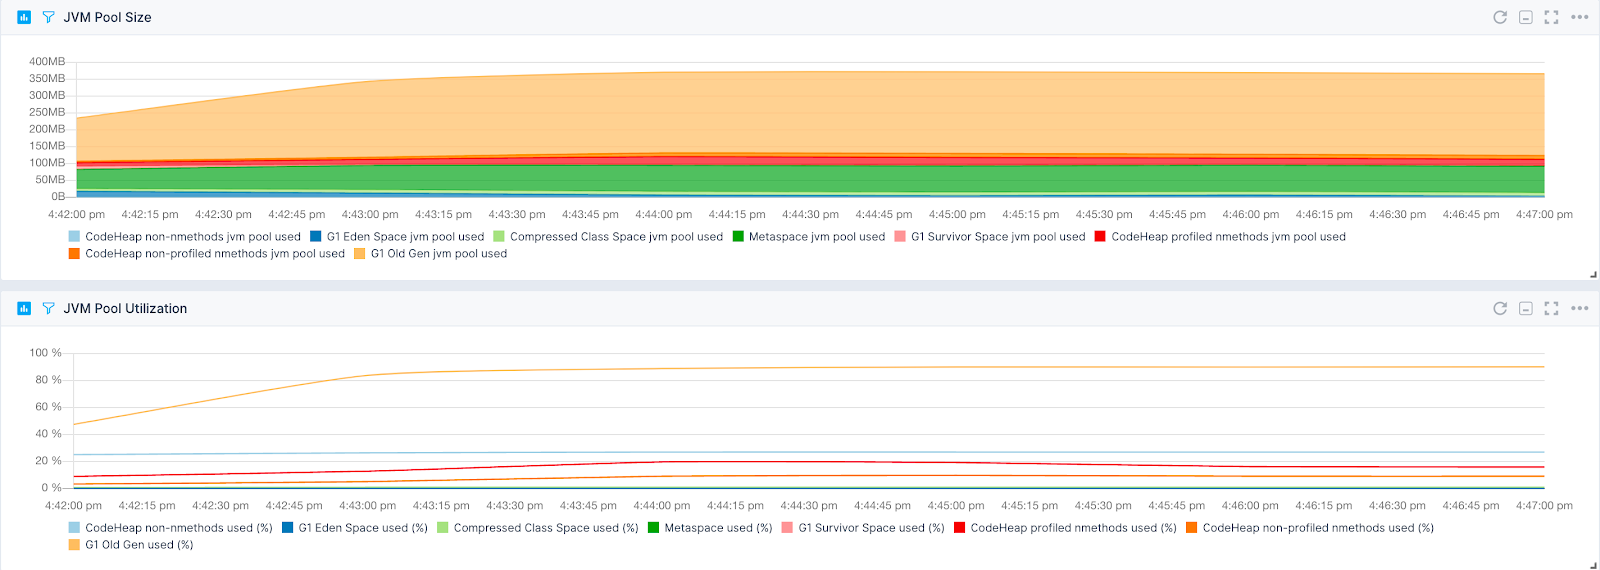
You can see that something started happening and that memory usage is constantly above 80% in the old generation space. Correlate that with garbage collector work:
And you can clearly see signs of high memory utilization. The garbage collector started doing more work while memory is not being cleared. That means that even though JVM is trying to clear the data – it can’t. This is a sign of trouble coming – we just don’t have enough space on the heap for new objects. But keep in mind this may also be a sign of Java memory leaks. If you see memory growth over time and garbage collection not being able to free the memory you may be hitting an issue with the application itself. Something worth checking.
So how do we set the heap size? By setting its minimum and maximum size. The minimum size is set using the -Xms JVM parameter and the maximum size is set using the -Xmx parameter. For example, to set the heap size for our application to be of size 2GB we would add -Xms2g -Xmx2g to our application startup parameters. In most cases, I would also set them to the same value to avoid heap resizing and in addition to that I would add the -XX:+AlwaysPreTouch flag as well to load the memory pages into memory at the start of the application.
We can also control the size of the young generation heap space by using the -Xmn property, just like the -Xms and -Xmx. This allows us to explicitly define the size of the young generation heap space when needed.
Serial Garbage Collector
The Serial Garbage Collector is the simplest, single-threaded garbage collector. You can turn on the Serial garbage collector by adding the -XX:+UseSerialGC flag to your JVM application startup parameters. We won’t focus on tuning the serial garbage collector.
With Sematext you can set thresholds and receive notification alerts whenever anomalies are detected, making troubleshooting easier.
Start your 30-day free trial See our plans
No credit card required – Get started in seconds
Parallel Garbage Collector
The Parallel garbage collector similar in its roots to the Serial garbage collector but uses multiple threads to perform garbage collection on your application heap. You can turn on the Parallel garbage collector by adding the -XX:+UseParallelGC flag to your JVM application startup parameters. To disable it entirely, use the -XX:-UseParallelGC flag.
Tuning the Parallel Garbage Collector
As we’ve mentioned The Parallel garbage collector uses multiple threads to perform its cleaning duties. The number of threads that the garbage collector can use is set by using the -XX:ParallelGCThreads flag added to our application startup parameters.
For example, if we would like 4 threads to do the garbage collection, we would add the following flag to our application parameters: -XX:ParallelGCThreads=4. Keep in mind that the more threads you dedicate to cleaning duties the faster it can get. But there is also a downside of having more garbage collection threads. Each GC thread involved in a minor garbage collection event will reserve a portion of the tenured generation heap for promotions. This will create divisions of space and fragmentation. The more the threads the higher the fragmentation. Reducing the number of Parallel garbage collection threads and increasing the size of the old generation will help with the fragmentation if that becomes an issue.
The second option that can be used is -XX:MaxGCPauseMillis. It specifies the maximum pause time goal between two consecutive garbage collection events. It is defined in milliseconds. For example, with a flag -XX:MaxGCPauseMillis=100 we tell the Parallel garbage collector that we would like to have the maximum pause of 100 milliseconds between garbage collections. The longer the gap between garbage collections the more garbage can be left on the heap making the next garbage collection more expensive. On the other hand, if the value is too small, the application will spend the majority of its time in garbage collection instead of executing business logic.
The maximum throughput target can be set by using the -XX:GCTimeRatio flag. It defines the ratio between the time spent in GC and the time spent outside of GC. It is defined as 1/(1 + GC_TIME_RATIO_VALUE) and it’s a percentage of time spent in garbage collection.
For example, setting -XX:GCTimeRatio=9 means that 10% of the application’s working time may be spent in the garbage collection. This means that the application should get 9 times more working time compared to the time given to garbage collection.
By default, the value of -XX:GCTimeRatio flag is set to 99 by the JVM, which means that the application will get 99 times more working time compared to the garbage collection which is a good trade-off for the server-side applications.
You can also control the adjustment of the generations of the Parallel garbage collector. The goals for the Parallel garbage collector are as follows:
- achieve maximum pause time
- achieve throughput, only if pause time is achieved
- achieve footprint only if the first two goals are achieved
The Parallel garbage collector grows and shrinks the generations to achieve the goals above. Growing and shrinking the generations is done in increments at a fixed percentage. By default, the generation grows in increments of 20% and shrinks in increments of 5%. Each generation is configured on its own. The percentage of the growth of a generation is controlled by the -XX:YoungGenerationSizeIncrement flag. The growth of the old generation is controlled by the -XX:TenuredGenerationSizeIncrement flag.
The shrinking part can be controlled by the -XX:AdaptiveSizeDecrementScaleFactor flag. For example, the percentage of the shrinking increment for the young generation is set by dividing the value of -XX:YoungGenerationSizeIncrement flag by the value of the -XX:AdaptiveSizeDecrementScaleFactor.
If the pause time goal is not achieved the generations will be shrunk one at a time. If the pause time of both generations is above the goal, the generation that caused threads to stop for a longer period of time will be shrunk first. If the throughput goal is not met then both the young and old generations will be grown.
The Parallel garbage collector can throw Java OutOfMemoryError exception if too much time is spent in garbage collection. By default, if more than 98% of the time is spent in garbage collection and less than 2% of the heap is recovered such an exception will be thrown. If we want to disable that behavior we can add the -XX:-UseGCOverheadLimit flag. But please be aware that garbage collectors working for an extensive amount of time and clearing very little or close to no memory at all usually means that your heap size is too low or your application suffers from memory leaks.
Once you know all of this we can start looking at garbage collector logs. They will tell us about the events that our Parallel garbage collector performs. That should give us the basic idea of where to start the tuning and which part of the heap is not healthy or could use some improvements.
Concurrent Mark Sweep Garbage Collector
The Concurrent Mark Sweep garbage collector, a mostly concurrent implementation that shares the threads used for garbage collection with the application. You can turn it on by adding the -XX:+UseConcMarkSweepGC flag to your JVM application startup parameters.
Tuning the Concurrent Mark Sweep Garbage Collector
Similar to other available collectors in the JVM world the CMS garbage collector is generational which means that you can expect two types of events to happen – minor and major collections. The idea here is that most work will be done in parallel to the application threads to prevent the tenured generation to get full. During normal work, most of the garbage collection is done without stopping application threads. CMS only stops the threads for a very short period of time at the beginning and the middle of the collection during the major collection. Minor collections are done in a very similar way to how the Parallel garbage collector works – all application threads are stopped during GC.
One of the signals that your CMS garbage collector needs tuning is concurrent mode failures. This indicates that the Concurrent Mark Sweep garbage collector was not able to reclaim all unreachable objects before the old generation filled up or there was simply not enough fragmented space in the heap tenured generation to promote objects.
But what about the concurrency we’ve mentioned? Let’s get back to the pauses for a while. During the concurrent phase, the CMS garbage collector pauses two times. The first is called the initial mark pause. It is used to mark the live objects that are directly reachable from the roots and from any other place in the heap. The second pause called remark pause is done at the end of the concurrent tracing phase. It finds objects that were missed during the initial mark pause, mainly because of being updated in the meantime. The concurrent tracing phase is done between those two pauses. During this phase, one or more garbage collector threads may be working to clear the garbage. After the whole cycle ends the Concurrent Mark Sweep garbage collector waits until the next cycle while consuming close to no resources. However, be aware that during the concurrent phase your application may experience performance degradation.
The collection of tenured generation space must be timed when using the CMS garbage collector. Because concurrent mode failures can be expensive we need to properly adjust the start of the old generation heap cleaning not to hit such events. We can do that by using the -XX:CMSInitiatingOccupancyFraction flag. It is used to set the percentage of the old generation heap utilization when the CMS should start clearing it. For example, starting at 75% we would set the mentioned flag to -XX:CMSInitiatingOccupancyFraction=75. Of course, this is only an informative value and the garbage collector will still use heuristics and try to determine the best possible value for starting its old generation cleaning job. To avoid using heuristics we can use the -XX:+UseCMSInitiatingOccupancyOnly flag. That way we will only stick to the percentage from the -XX:CMSInitiatingOccupancyFraction setting.
So when setting the -XX:+UseCMSInitiatingOccupancyOnly flag to a higher value you delay the cleaning of the old generation space on the heap. This means that your application will run longer without the need for CMS kicking in to clear the tenured space. But, when the process starts it may be more expensive because it will have more work. On the other hand, setting the -XX:+UseCMSInitiatingOccupancyOnly flag to a lower value will make the CMS tenured generation cleaning more often, but it may be faster. Which one to choose depends on your application and needs to be adjusted per use case.
We can also tell our garbage collector to collect the young generation heap during the remark pause or before doing the Full GC. The first is done by adding the -XX:+CMSScavengeBeforeRemark flag to our startup parameters. The second is done by adding the -XX:+ScavengeBeforeFullGC flag to our application startup parameters. As a result, it can improve garbage collection performance as it will not need to check for references between the young and old generation heap spaces.
The remark phase of the Concurrent Mark Sweep garbage collector can potentially speed it up. By default it is single-threaded and as you recall we’ve mentioned that it stops all the application threads. By including the -XX:+CMSParallelRemarkEnabled flag to our application startup parameters, we can force the remark phase to use multiple threads. However, because of certain implementation details, it is not actually always true that the concurrent version of the remark phase will be faster compared to the single-threaded version. That’s something you have to check and test in your environment.
Similar to the Parallel garbage collector, the Concurrent Mark Sweep garbage collector can throw OutOfMemory exceptions if too much time is spent in garbage collection. By default, if more than 98% of the time is spent in garbage collection and less than 2% of the heap is recovered such an exception will be thrown. If we want to disable that behavior we can add the -XX:-UseGCOverheadLimit flag. The difference compared to the Parallel garbage collector is that the time that counts towards the 98% is only counted when the application threads are stopped.
G1 Garbage Collector
G1 garbage collector, the default garbage collector in the newest Java versions targeted for latency-sensitive applications. You can turn it on by adding the -XX:+G1GC flag to your JVM application startup parameters.
Tuning G1 Garbage Collector
There are also two things worth mentioning. The G1 garbage collector tries to perform longer operations in parallel without stopping the application threads. The quick operations will be performed faster when application threads are paused. So it’s yet another implementation of mostly concurrent garbage collection algorithms.
The G1 garbage collector cleans memory mostly in evacuation fashion. Live objects from one memory area are copied to a new area and compacted along the way. After the process is done, the memory area from which the object was copied is again available for object allocation.
On a very high level, the G1GC goes between two phases. The first phase is called young-only and focuses on the young generation space. During that phase, the objects are moved gradually from the young generation to the old generation space. The second phase is called space reclamation and is incrementally reclaiming the space in the old generation while also taking care of the young generation at the same time. Let’s look closer at those phases as there are some properties we can tune there.
The young-only phase starts with a few young-generation collections that promote objects to the tenured generation. That phase is active until the old generation space reaches a certain threshold. By default, it’s 45% utilization and we can control that by setting the -XX:InitiatingHeapOccupancyPercent flag and its value. Once that threshold is hit, G1 starts a different young generation collection, one called concurrent start. The -XX:InitiatingHeapOccupancyPercent flag which controls the Initial Mark collection is the initial value that is further adjusted by the garbage collector. To turn off the adjustments add -XX:-G1UseAdaptiveIHOP flag to your JVM startup parameters.
The concurrent start, in addition to the normal young generation collection, starts the object marking process. It determines all live, reachable objects in the old generation space that need to be kept for the following space reclamation phase. To finish the marking process two additional steps are introduced – remark and cleanup. Both of them pause the application threads. The remark step performs global processing of references, class unloading, completely reclaims empty regions and cleans up internal data structures. The cleanup step determines if the space-reclamation phase is needed. If it’s needed the young-only phase is ended with Prepare Mixed young collection and the space-reclamation phase is launched.
The space-reclamation phase contains multiple Mixed garbage collections that work on both young and old generation regions of the G1GC heap space. The space-reclamation phase ends when the G1GC sees that evacuating more old generation regions wouldn’t give enough free space to make the effort of reclaiming the space worthwhile. It can be set by using the -XX:G1HeapWastePercent flag value.
We can also control, at least to some degree, if the periodic garbage collection will run. By using the -XX:G1PeriodicGCSystemLoadThreshold flag we can set the average load above which the periodic garbage collection will not be run. For example, if our system is load is 10 for the last minute and we set the -XX:G1PeriodicGCSystemLoadThreshold=10 flag, the period garbage collection will not be executed.
The G1 garbage collector, apart from the -Xmx and -Xms flags, allows us to use a set of flags to size the heap and its regions. We can use the -XX:MinHeapFreeRatio to tell the garbage collector the ratio of the free memory that should be achieved and the -XX:MaxHeapFreeRatio flag to set the desired maximum ratio of the free memory on the heap. We also know that G1GC tries to keep the young generation size between the values of -XX:G1NewSizePercent and -XX:G1MaxNewSizePercent. That also determines the pause times. Decreasing the size may speed up the garbage collection process at the cost of less work. We can also set the strict size of the young generation by using the -XX:NewSize and the -XX:MaxNewSize flags.
The documentation on tuning the G1 garbage collector says that we shouldn’t touch it in general. Eventually, we should only modify the desired pause times for different heap sizes. Fair enough. But, it’s also good to know what and how we can tune and how those properties affect the G1 garbage collector behavior.
When tuning for garbage collector latency we should keep the pause time to a minimum. Meaning that in most cases the -Xmx and -Xms values should be set to the same value and we should also load the memory pages during application start by using the -XX:+AlwaysPreTouch flag.
If your young-only phase takes too long it’s a sign that decreasing the -XX:G1NewSizePercent (defaults to 5) value is a good idea. In some cases decreasing the -XX:G1MaxNewSizePercent (defaults to 60) can also help. If the Mixed collections take too long we are advised to increase the value of -XX:G1MixedGCCountTarget flag to spread the tenured generation GC across more collections. Increase the -XX:G1HeapWastePercent to stop the old generation garbage collection earlier. You can also change the -XX:G1MixedGCLiveThresholdPercent – it defaults to 65 and controls the occupancy threshold above which the old generation heap will be included in the mixed collection. Increasing this value will tell garbage collection to omit less occupied old generation space regions when doing the mixed collection. Regions that have a lot of objects in them take a longer time to collect garbage from. By using the mentioned flag we can avoid setting these regions as candidates for garbage collection. If you’re seeing a high update and scan RS times, decreasing the -XX:G1RSetUpdatingPauseTimePercent flag value, including the -XX:-ReduceInitialCardMarks flag, and increasing the -XX:G1RSetRegionEntries flag may help. There is also one additional flag, the -XX:MaxGCPauseTimeMillis (defaults to 250) which defines the maximum, desired pause time. If you would like to reduce the pause time, lowering the value may help as well.
When tuning for throughput we want the garbage collector to clean as much garbage as possible. Mostly in cases of systems that process and hold a lot of data. The first thing that you should go for is increasing the -XX:MaxGCPauseMillis value. By doing that we relax the garbage collector. This allows it to work longer to process more objects on the heap. However, that may not be enough. In such cases increasing the -XX:G1NewSizePercent flag value should help. In some cases the throughput may be limited by the size of young generation regions – in such cases increasing the -XX:G1MaxNewSizePercent flag value should help.
We can also decrease the parallelism which requires a lot of work from the CPU. Using the -XX:G1RSetUpdatingPauseTimePercent flag and increasing its value will allow more work when the application threads are paused and will decrease the time spent in concurrent parts of the phase. Also similar to latency tuning you may want to keep the -Xmx and -Xms flags to the same value to avoid heap resizing. Load the memory pages to memory by using the -XX:+AlwaysPreTouch flag and the -XX:+UseLargePages flag. But please remember to apply the changes one by one and compare the results so that you understand what is happening.
Finally, we can tune for heap size. There is a single option that we can think about here, the -XX:GCTimeRatio (defaults to 12). It determines the ratio of time spent in garbage collection compared to application threads doing their work and is calculated as 1/(1 + GCTimeRatio). The default value will result in about 8% of the application working time to be spent in garbage collection, which is more than the Parallel GC. More time in garbage collection will allow clearing more space on the heap, but this is highly dependent on the application and it is hard to give general advice. Experiment to find the value that suits your needs.
There are also general tunable parameters for the G1 garbage collector. We can control the degree of parallelization when using this garbage collector. By including the -XX:+ParallelRefProcEnabled flag and changing the -XX:ReferencesPerThread flag value. For each N references defined by the -XX:ReferencesPerThread flag a single thread will be used. Setting this value to 0 will tell the G1 garbage collector to always use the number of threads specified by the -XX:ParallelGCThreads flag value. For more parallelization decrease the -XX:ReferencesPerThread flag value. This should speed up the parallel parts of the garbage collection.
With Sematext you get full visibility into all garbage collection types to help you tune it for optimal performance.
Get started See our plans
No credit card required – Get started in seconds
Z Garbage Collector
Still experimental, very scalable and low latency implementation. If you would like to experiment with that Z garbage collector you must use JDK 11 or newer and add the -XX:+UseZGC flag to your application startup parameters along with the -XX:+UnlockExperimentalVMOptions flag as the Z garbage collector is still considered experimental.
Tuning the Z Garbage Collector
There aren’t many parameters that we can play around with when it comes to the Z garbage collector. As the documentation states, the most important option here is the maximum heap size, so the -Xmx flag. Because the Z garbage collector is a concurrent collector, the heap size must be adjusted in a way that it can hold the live set of objects of your application and allows for the headroom to allow allocations while the garbage collector is running. This means that the heap size may need to be higher compared to other garbage collectors and the more memory you assign to the heap the better results you may expect from the garbage collector.
The second option that you can expect is, of course, the number of threads that the Z garbage collector will use. After all, it is a concurrent collector, so it can utilize more than a single thread. We can set the number of threads that the Z garbage collector will use by using the -XX:ConcGCThreads flag. The collector itself uses heuristics to choose the proper number of threads it should use, but as usual, it is highly dependent on the application and in some cases setting that number to a static value may bring better results. However, that needs to be tested as it is very use-case dependent. There are two things to remember though. If you assign too many threads for the garbage collector your application may not have enough computing power to do its job. Set the number of garbage collector threads to a low number and the garbage may not be collected fast enough. Take that into consideration when tuning.
Other JVM Options
We’ve covered quite a lot when it comes to garbage collection parameters and how they affect garbage collection. But, not everything. There is way more to it than that. Of course, we won’t talk about every single parameter, it just doesn’t make sense. However, there are a few more things that you should know about.
JVM Statistics Causing Long Garbage Collection Pauses
Some people reported that on Linux systems, during high I/O utilization the garbage collection can pause threads for a long period of time. This is probably caused by the JVM using a memory-mapped file called hsperfdata. That file is written in the /tmp directory and is used for keeping the statistics and safepoints. The mentioned file is updated during GC. On Linux, modifying a memory-mapped file can be blocked until I/O completes. As you can imagine such an operation can take a longer period of time, presumably hundreds of milliseconds.
How to spot such an issue in your environment? You need to look into the timings of your garbage collection. If you see in the garbage collection logs that the real-time spent by the JVM for garbage collection is way longer than the user and system metrics combined you have a potential candidate. For example:
[Times: user=0.13 sys=0.11, real=5.45 secs]
If your system is heavily I/O based and you see the mentioned behavior you can move the path of your GC logs and the tmpfs to a fast SSD drive. With recent JDK versions, the temporary directory that Java uses is hardcoded, so we can’t use the -Djava.io.tmpdir to change that. You can also include the -XX:+PerfDisableSharedMem flag to your JVM application parameters. You need to be aware that including that option will break tools that are using the statistics from the hsperfdata file. For example, jstat will not work.
You can read more on that issue in the blog post from the Linkedin engineering team.
Heap Dump on Out Of Memory Exception
One thing that can be very useful when dealing with Out Of Memory exceptions, diagnosing their cause, and looking into problems like memory leaks are heap dumps. A heap dump is basically a file with the contents of the heap written on disk. We can generate heap dumps on demand, but it takes time and can freeze the application or, in the best-case scenario, make it slow. But if our application crashes we can’t grab the heap dump – it’s already gone.
To avoid losing information that can help us in diagnosing problems we can instruct the JVM to create a heap dump when the OutOfMemory error happens. We do that by including the -XX:+HeapDumpOnOutOfMemoryError flag. We can also specify where the heaps should be stored by using the -XX:HeapDumpPath flag and setting its value to the location we want to write the heap dump to. For example: -XX:HeapDumpPath=/tmp/heapdump.hprof.
Keep in mind that the heap dump file may be very big – as large as your heap size. So you need to account for that when setting the path where the file should be written. We’ve seen situations where the JVM was not able to write the 64GB heap dump file on the target file system.
For analysis of the file, there are tools that you can use. There are open-source tools like MAT and proprietary tools like YourKit Java Profiler or JProfiler. There are also services like heaphero.io that can help you with the analysis, while older versions of the Oracle JDK distribution come with jhat – the Java Heap Analysis Tool. Choose the one that you like and fit your needs.
Using -XX:+AggressiveOpts
The -XX:+AgressiveOpts flag turns on additional flags that are proven to result in an increase in performance during a set of benchmarks. Those flags can change from version to version and contain options like large autoboxing cache and removal of aggressive autoboxing. It also includes disabling the biased locking delay. Should you use this flag? That depends on your use case and your production system. As usual, test in your environment, compare instances with and without the flag, and see how large of a difference it makes.
Sematext provides a detailed view of your GC, thread, and memory usage monitoring out of the box.
Try it free for 14 days See our plans
No credit card required – Get started in seconds
Conclusion
Tuning garbage collection is not an easy task. It requires knowledge and understanding. You need to know the garbage collector that you are working with and you need to understand your application’s memory needs. Every application is different and has different memory usage patterns, thus requiring different garbage collection strategies. It’s also not a quick task. It will take time and resources to make improvements in iterations that will show you if you are going in the right direction with each and every change.
Remember that we only touched the tip of the iceberg when it comes to tuning garbage collectors in the JVM world. We’ve only mentioned a limited number of available flags that you can turn on/off and adjust. For additional context and learning, I suggest going to Oracle HotSpot VM Garbage Collection Tuning Guide and reading the parts that you think may be of interest to you. Look at your garbage collection logs, analyze them, try to understand them. It will help you in understanding your environment and what’s happening inside the JVM when garbage is collected. In addition to that, experiment a lot! Experiment in your test environment, on your developer machines, experiment in some of the production or pre-production instances and observe the difference in behavior.
Hopefully, this article will help you on your journey to a healthy garbage collection in your JVM-based applications. Good luck!